Unlock the Best Tableau Functions for Advanced
Data Analysis in 2025
Table of Contents
- jaro education
- 24, November 2024
- 6:00 pm
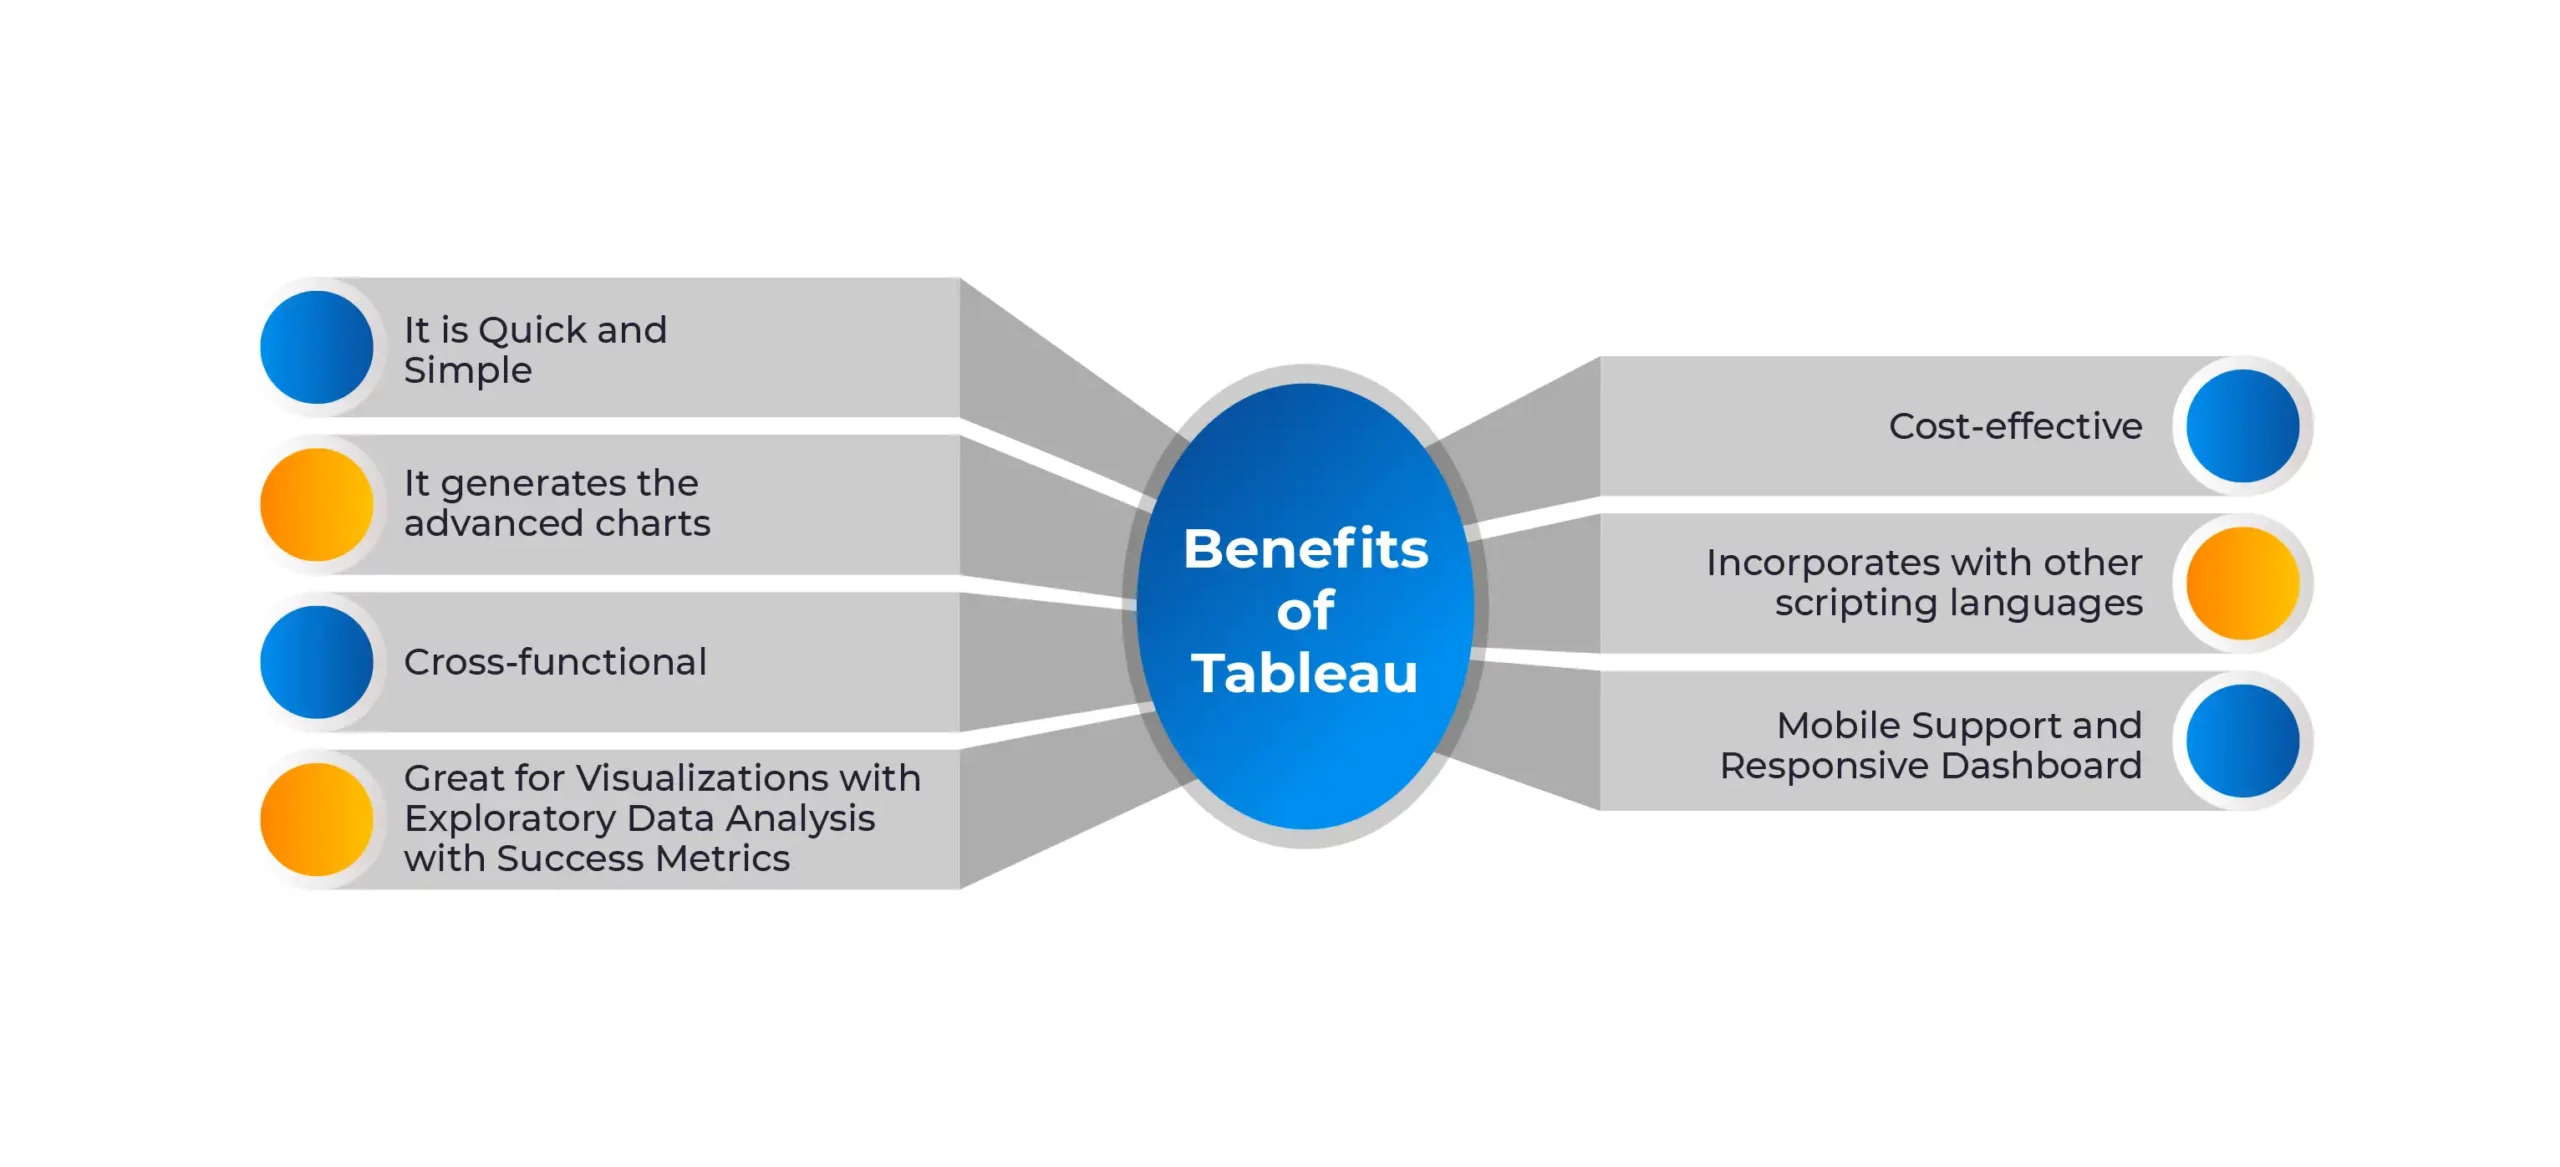
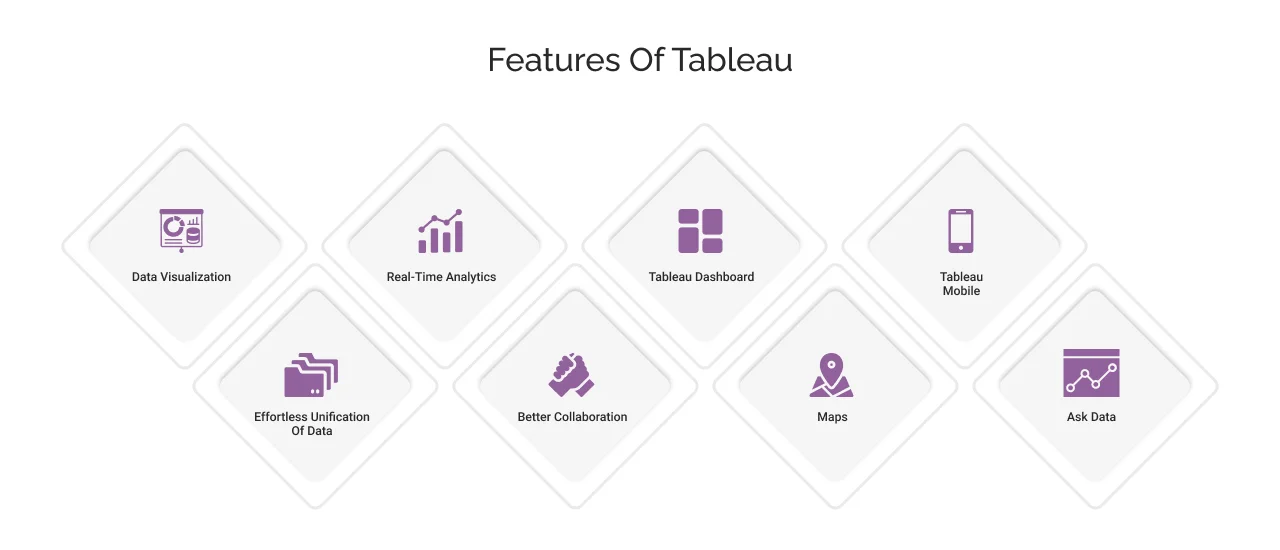
The business world needs a tool that bridges the gap between technology and its operations for data-driven decision making. That’s where Tableau comes in. It comes with intuitive visualization tools, powerful analytics and easily accessible metrics that make complex data understandable. As businesses increase their reliance on data, both technical and non-technical users need a tool that can show succinct metrics. Tableau’s interactive functions and dashboards empower teams to analyze trends, forecast outcomes, and stay agile, giving companies a competitive edge in a tech-driven market.
*edoxi.com
Uses of Tableau Functions:
Tableau features come with a wide variety of uses for any business organization. It helps munch complex data and provide actionable insights, making it a must-have tool in your arsenal, irrespective of your job role in a business environment.
1. Data Accessibility:
- Tableau connects easily to various tools like Excel and SQL to give you an easy and consolidated analysis.
- It also supports live metrics and real-time updates, ensuring dynamic and data-driven decisions.
2. User-Friendly Interface:
- Tableau allows both technical and non-technical users to easily access its tools with interactive dashboards and easy features.
- Its drag-and-drop functionality makes it easy to retrieve data.
3. Collaborations
- Tableau features can be accessed through any computer, across teams, with interactive dashboards.
- Makes it easier to be aligned with different teams and while working remote.
4. Market Edge
- Tableau is the best way to be on top of business data and understand customer reactions to products and services.
- An expertise in Tableau functions guarantees business agility and an edge in the market.
5. Advanced Analytics
- Lastly, the tool offers powerful Tableau functions like Level of Detail expressions, aggregation and set actions.
- This supports complex analyses, customized calculations and trend forecasting.
5 Best Tableau Functions for Advanced Data Analytics: What Tableau Features Should You Know?
Here’s a breakdown of Tableau functions that can help elevate your advanced data analytics decisions in the workplace. Each of these functions provides advanced capabilities for businesses to explore data trends and customer needs. If you are an aspiring data analyst or a working professional looking to brush up your Tableau functions, read on!
1. Segmentation and Cohort Analysis:
Customer purchasing behavior and sales patterns are complex. These aspects need advanced Tableau features like segmentation and cohort analysis for accurate categorization based on specific characteristics.
For example, take an OTT platform like Jio Cinema that runs on a subscription model. If they want to understand their customer patterns and retention rates, they would segment users based on when they subscribe and how long their accounts remain active over the next few months. Cohort analysis is a Tableau function that can help.
Step 1: Identify the cohort month for each customer (so data for each month is neatly categorized)
{ FIXED [Customer Username] : MIN(DATE_TRUNC(‘month’, [Sign-Up Date])) }
Step 2: Using a heat map Tableau function, track when the subscription starts and how long these customers stay on. Using the heatmap clusters, you can analyze when and where the retention reduces, and drop-offs start to occur.
2. Parameter Actions
Parameter actions are a set of Tableau features that allow data analysts to explore metrics and filters in real-time through a Tableau dashboard. With this real-time data, businesses can decide and change their strategies on-the-go.
For example, if a clothing chain wants to explore the sales performance of a particular city’s stores, it can select the area on the dashboard and use parameter actions to update charts in real time.
Step 1: Create a parameter for ‘Selected cities’ you want to track.
Step 2: Set up a parameter action that tracks back to the ‘Selected cities’ input
Step 3: Use the parameter to filter data about sales.
IF [CITY]= [Selected Cities] THEN [Sales] ELSE NULL END
Now, all the data about that city such as sales, customers and profit margin will get filtered out for effective comparisons without the need for manual filters.
3. Set Actions
Set Actions are one of the most effective ways for advanced data analysis with Tableau functions. They are customizable inputs that can change data points and help with future predictions based on different potential scenarios. This is where deeper analysis and interpretations can be made.
For example, a skincare company wants to see and compare the differences in sales, profits and customer ratings for three different products. With the set action Tableau function, you can select any product from the dashboard and pull up metrics for comparison.
Step 1: Create a set for ‘Selected Skincare Products’.
Step 2: Input a set action that impacts and updates ‘Selected Skincare Products’ whenever you click on a product.
Step 3: Use this set to calculate metrics for the selected skincare products.
IF [Skincare Product] IN [Selected Skincare Products] THEN [SALES] ELSE NULL END
With this set action, you can click on multiple products and compare metrics to identify which ones have good sales and which ones need help.
4. LOD Expressions
LOD, or Level of Detail, is a Tableau feature that allows complex calculations and detailed analyses based on various data levels. It enables advanced data analytics and opens doors for strategic predictions.
For example, a bookstore wants to calculate the average spending per customer across different segments such as VIP and regular, independent of the time period or any other aspects.
Step 1: Use a FIXED Level of Detail expression to calculate total purchases per customer.
Step 2: Use another FIXED LOD expression to derive the average spend by segment.
{ FIXED [Customer Segment] : AVG([Customer Lifetime Spend]) }
This way, businesses can use Tableau data to see average spend by segment and make plans to improve segments with lower sales.
5. Dual-Axis Charts:
Dual-axis charts help combine two different inputs on the same chart, often using different visual tools to derive data. These Tableau features compare related data like sales vs profits, target vs actual performance.
For example, an ice cream store wants to compare sales vs profit to understand if their increased sales led to higher profits.
Step 1: Plot sales on one axis of the bar chart.
Step 2: Add profits on the second axis as a line chart.
Step 3: Synchronize these two axes and compare the metrics.
*cyntexa.com
This is one of the best ways to understand advanced data analysis and interpret different data over time. If the profit margin does not grow with sales, the ice cream store might have pricing issues or too many discounts, which this data will help address.
Summing up:
| Tableau Functions | How it Helps Advanced Data Analytics |
|---|---|
| Segmentation and cohort analysis | Accurate categorization based on specific characteristics |
| Parameter actions | Explore metrics and filters in real-time through a Tableau dashboard. |
| Set actions | Set Customizable inputs that can change data points and help with future predictions based on different potential scenarios. |
| LOD Expressions | Allows complex calculations and detailed analyses based on various data levels. |
| Dual Axis Charts | Combine two different inputs on the same chart, often using different visual tools to derive data. |
Additional Advanced Data Analysis Functions with Tableau
Here are more Tableau features that help with advanced data analytics, enabling businesses to understand customer trends, patterns and more:
| Tableau Functions | How it Helps Advanced Data Analytics |
|---|---|
| Trend Analysis | Using Tableau functions like WINDOW_SUM and WINDOW_AVG, trends and patterns for sales, repeat customers, profits, etc., can be calculated. |
| Churn Analysis | Using Boolean logic, Tableau tracks consumer activity to plan and execute products and services accordingly. |
| Aggregations and time-based calculations | This function uses segmentation to calculate customer predictions over time, for long-term growth projections and profit margins. |
Study Advanced Data Analysis Courses with Jaro Education
Jaro Education works with top tech schools in the country to offer advanced data analysis certification courses for students and working professionals to be up to date with technological trends in the business world. Along with these certification courses, Jaro Education’s education experts provide:
- Career guidance and counseling
- 1:1 mentorship for application processes
- Free certification courses and AI-powered tools
Some advanced data analysis courses from top tech schools:
| University | Course |
|---|---|
| IIM Kozhikode | Professional Certificate Programme in Data Science for Business Decisions |
| XLRI Jamshedpur | Executive Development Programme in Digital HR Transformation and AI-Driven HR Analytics |
| IIM Nagpur | PG Certificate Programme in Cybersecurity Management and Data Science |
Apply now and access advanced data analysis and tools like Tableau to make a mark in the business world.
Final Thoughts
Using Tableau functions provides an incredible edge to businesses everywhere. It opens a new world of data-centric decisions, improving products and services and ultimately cementing business success in a competitive world.
Frequently Asked Questions
Tableau has several functions, but overall, it provides easy access to market and consumer data with interactive dashboards, dynamic, real-time metrics and easy comparison tools to analyze and make data-driven decisions.
Tableau offers so many more dynamic and interactive data visualization tools compared to Excel. It is also easy to learn and operate, making it efficient for both technical and non-technical professionals to work with and gain customer insights driven by metrics.
Tableau is a functional tool that offers interactive ways to read, interpret and analyze data, trends and patterns. It is a tool that helps individuals and businesses stay on top of customer needs and make data-driven decisions for long-term growth and profitability.
While the functions and features of Tableau are used for advanced data analysis, it is designed to be accessed by both tech and non-tech users. The whole idea of the tool is to bridge the gap between tech and business operations with easy-to-access data tools and interpretations.
Tableau uses SQL queries but makes it way easier to access its cues and code. It already has in-built tools and functions you can drag and drop to get real-time metrics.


