Powerful Analysis Methods by Data Scientists in the Modern World

Table of Contents

Powerful-Analysis-Methods-by-Data-Scientists-in-the-Modern-World

In our data-driven society, data scientists play a vital role in distilling vast amounts of data into useful conclusions for action. Data scientists use important tools and techniques for everything from analyzing market variables to assessing consumer behavior, helping to inform business strategies across sectors. Can you imagine predicting sales growth and understanding customers? Would it be possible to predict your preferences or the next big trend in your industry? With an effective data analysis method, this is all possible.

In this post, we will review some of the most prominent analysis methods given by data scientists today. It is not relevant whether you are a professional data worker or just beginning; knowing these methods will further enhance your ability to derive insights from data. We will discuss regression analysis, Monte Carlo simulations, factor analysis, cohort analysis, cluster analysis, time series analysis, and sentiment analysis. Each of these data analysis methods has inherent strengths and is useful in application. We will assist you in comprehending the potential applications of each analysis method for your company.

Modern World Data Analysis Techniques

Now that we’re familiar with some of the different types of data, let’s focus on the topic at hand: different methods for analyzing data.

Regression Analysis

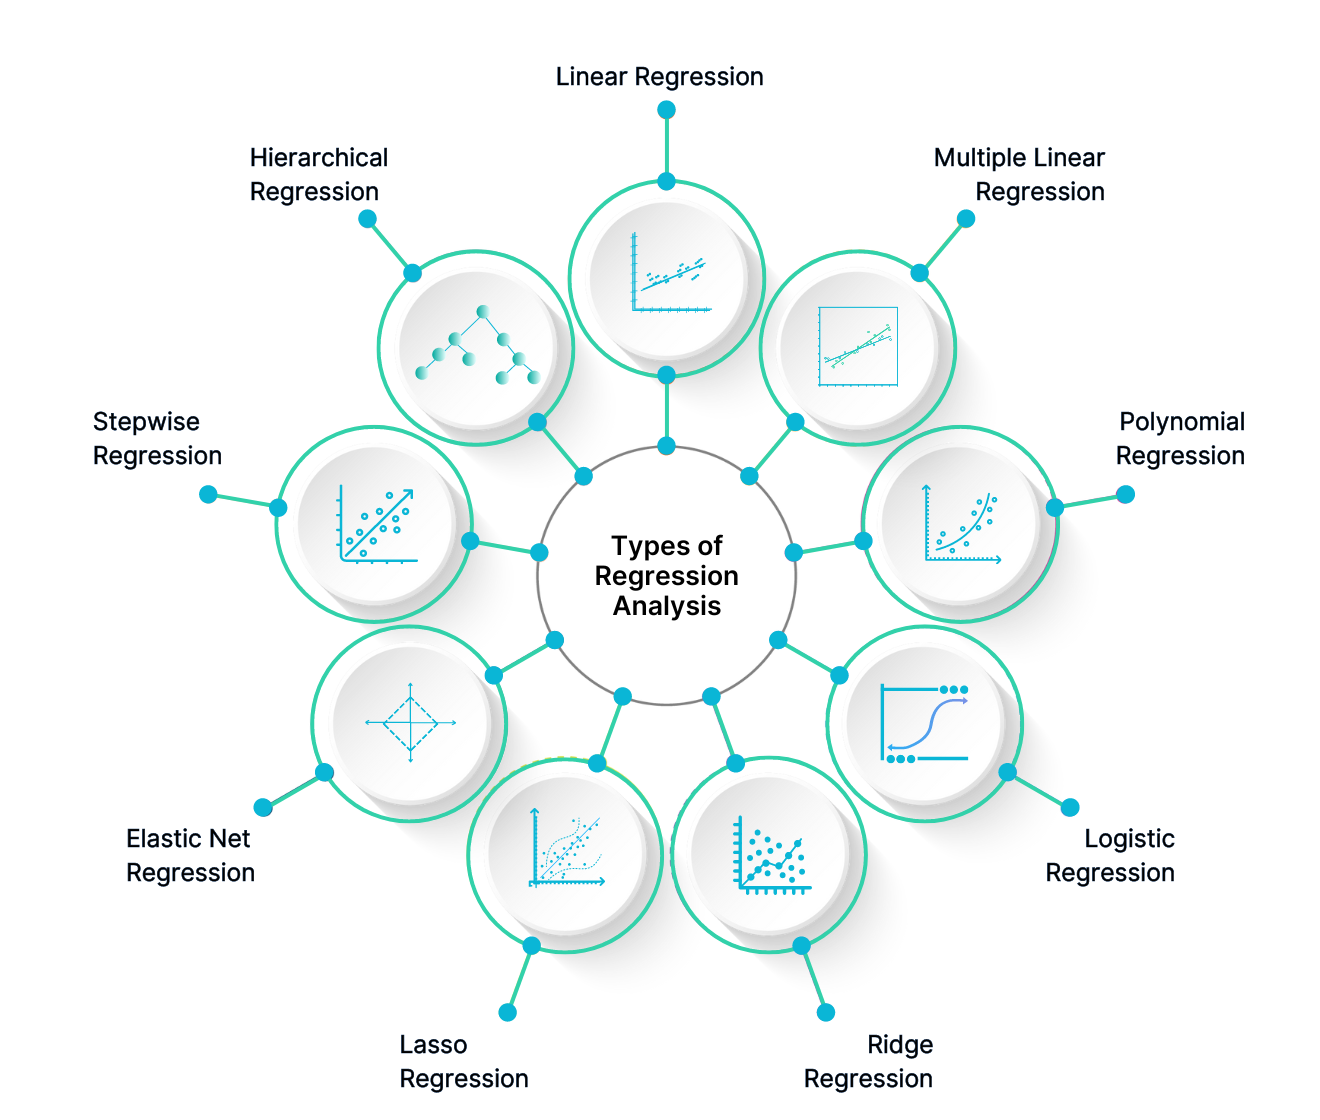
Regression analysis is a powerful statistical technique utilized to estimate and quantify the relationships between variables. More specifically, regression analysis equips us with the information necessary to understand how a dependent variable, such as sales revenues, varies, or is explained, by one or more independent variables (marketing expenditures, customer characteristics, and so on). Overall, the main purpose of regression analysis is to obtain information about trends and relationships used to influence decision-making or predict the future. 

As an example, let’s say you work for an e-commerce company and want to analyze the relationship between the amount of money spent on social media marketing (independent variable) and the resulting sales revenue (dependent variable). By using regression analysis, you would be able to see the extent to which increased spending would lead to increased sales. If there is a positive correlation, then we might want to increase our spending on social media to grow sales, while no correlation may imply that the spending is not effective at producing high revenues.

It’s essential to remember, though, that regression analysis can show relationships but doesn’t imply causation. Just because two variables move together doesn’t mean one causes the other. Thus, while regression analysis is an excellent tool for identifying trends, it should be used in conjunction with other methods for a more comprehensive understanding.

Types of regression analysis

Monte Carlo Simulation

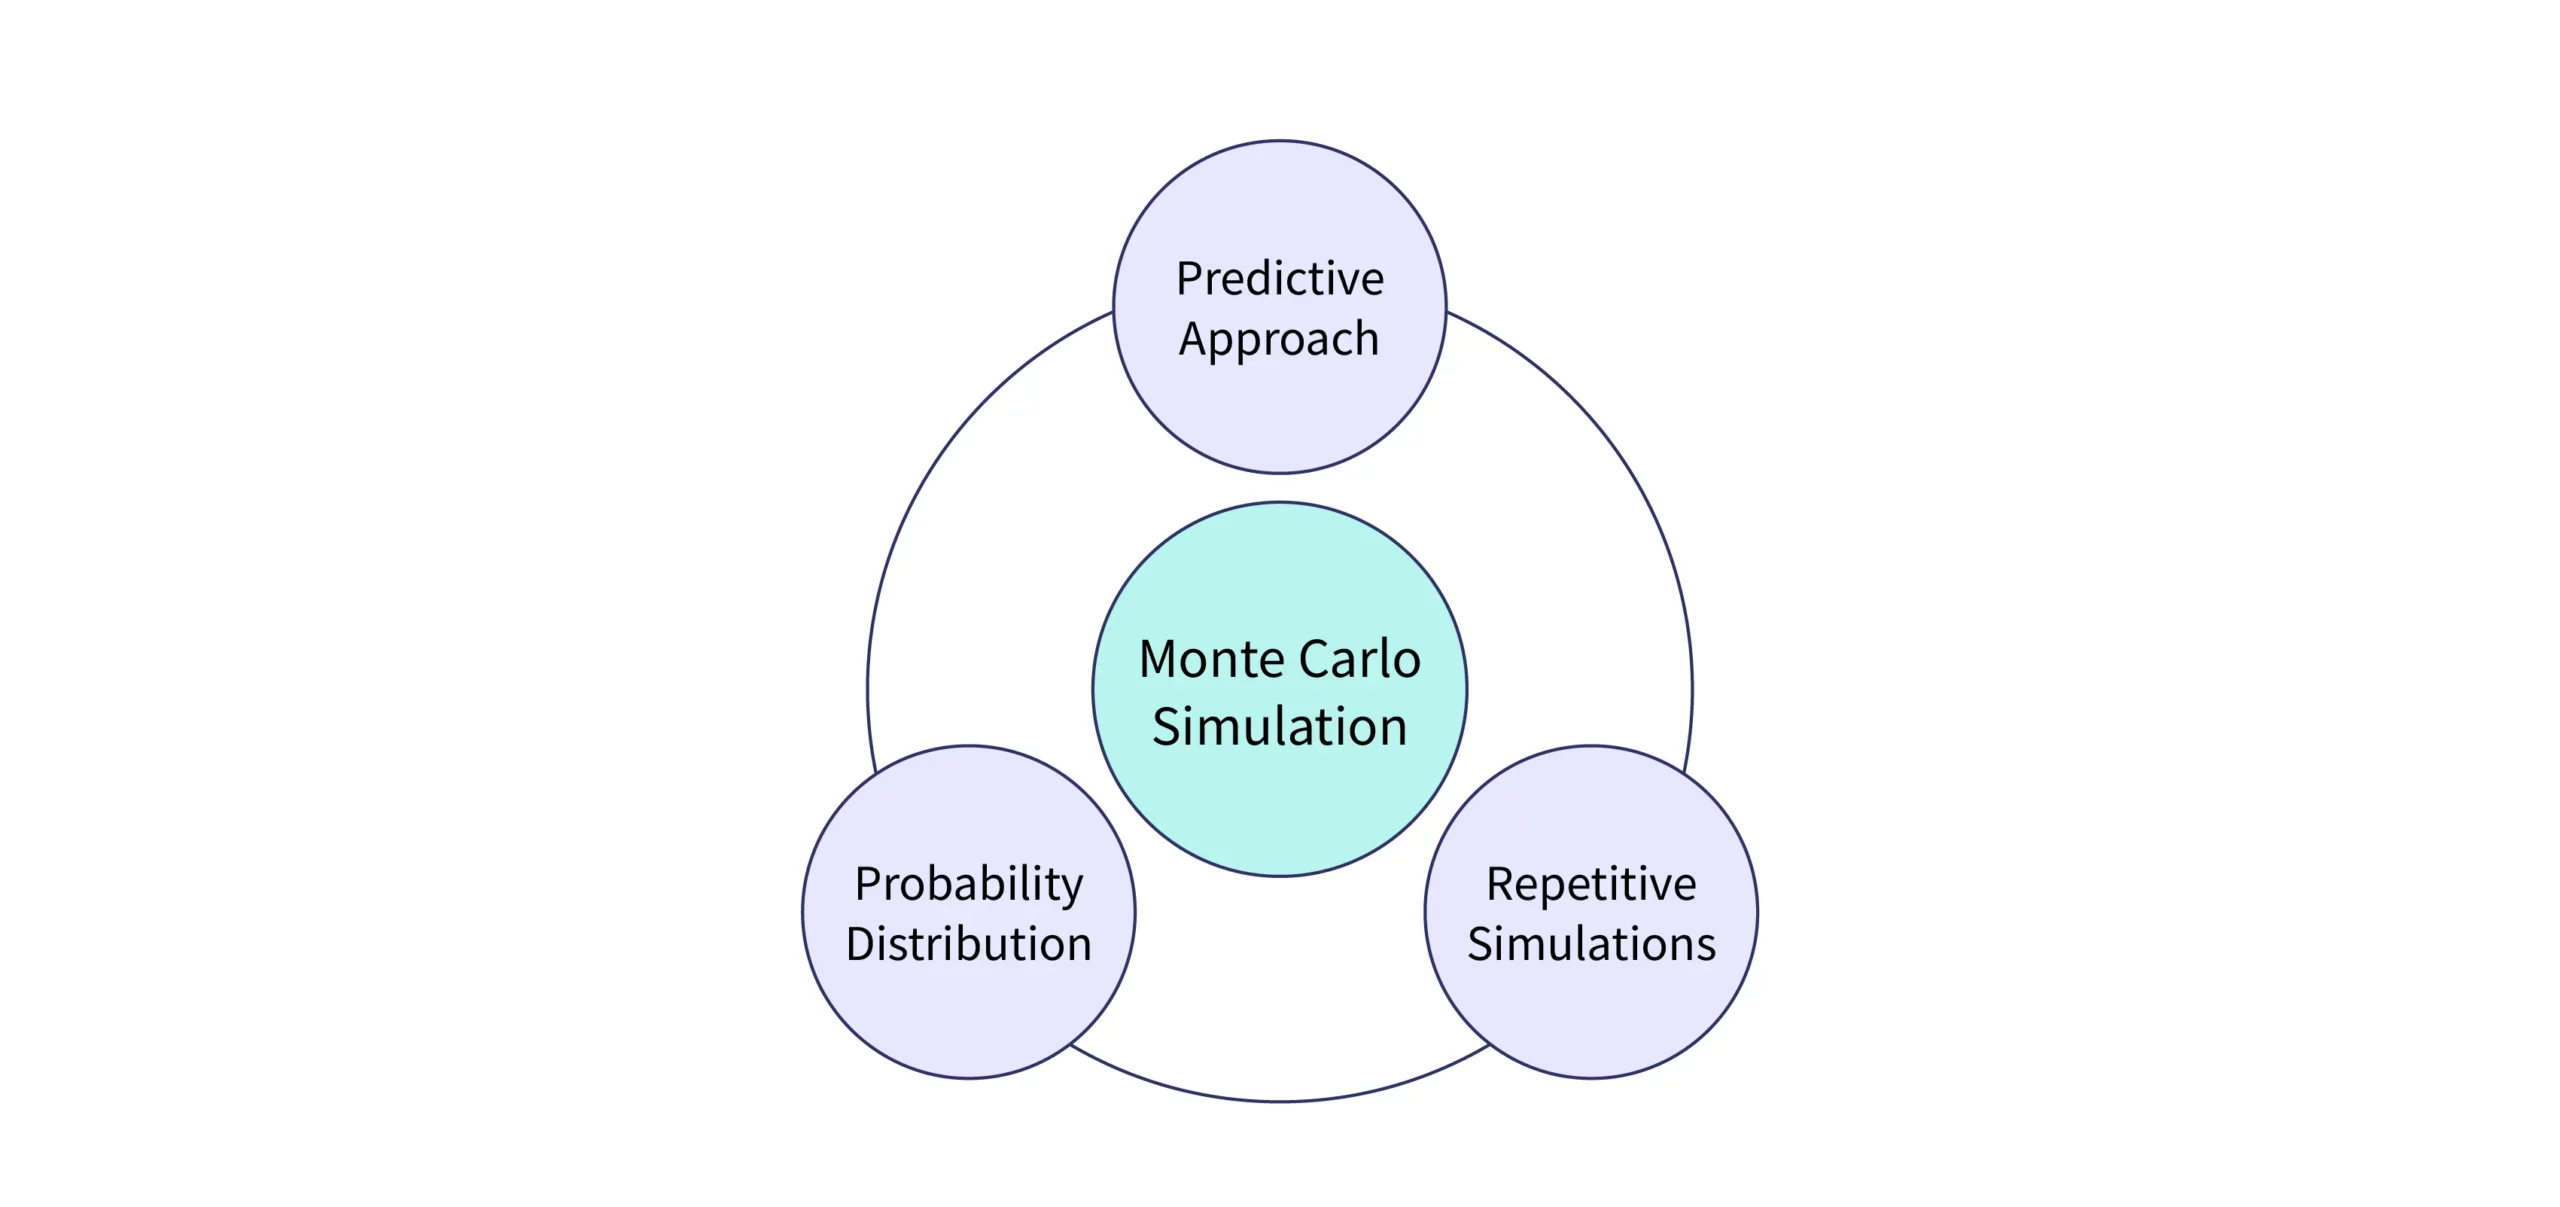
Monte Carlo simulation is a sophisticated approach used to estimate the likelihood of multiple outcomes when there is uncertainty. This other type of data analytics is present in many domains, including financial analysis, engineering, and project management, when evaluating risk and aiding in decision-making.  For example, you might be preparing to launch a new product.

There are many different uncertainties involved, including costs of the project, estimated sales, and market coverage. With the Monte Carlo simulation, you can derive a model that captures those uncertainties. Monte Carlo creates thousands of different scenarios by selecting from combinations of those uncertainties so you can see a range of possibilities. 

If you were trying to estimate profit from a new product, you would input uncertainties such as estimated sales quantities, price, and costs of marketing and using the estimation model, the simulation would run through hundreds of iterations to estimate your likelihood of attaining different levels of profit. Monte Carlo is one of the most useful data analysis techniques because it allows decision-makers to understand the benefits and risks more clearly.

Factor Analysis

Monte Carlo simulation

*scaler.com

Factor Analysis

Factor analysis is a method used to reduce a larger set of variables into fewer, meaningful factors. It is particularly helpful when you have a large dataset, and it can help you find patterns and relationships that are not readily available in the data. 

For instance, let’s say you administered a survey with several questions about customer preferences and behaviors. Factor analysis allows you to combine or group similar responses rather than using each question separately for your analysis.  After grouping the questions, there may be a latent factor statement, such as “customer satisfaction,” that could provide you with meaningful insights to conduct a further analysis of customer preferences and behavior. 

Factoring reduces the data complexity and allows your organization to focus on what drives customers’ behaviors. Pattern recognition reduces complexity and will assist organizations in deciding on how to conduct effective marketing or improve their products based on consumer preferences and behaviors.

Cohort Analysis

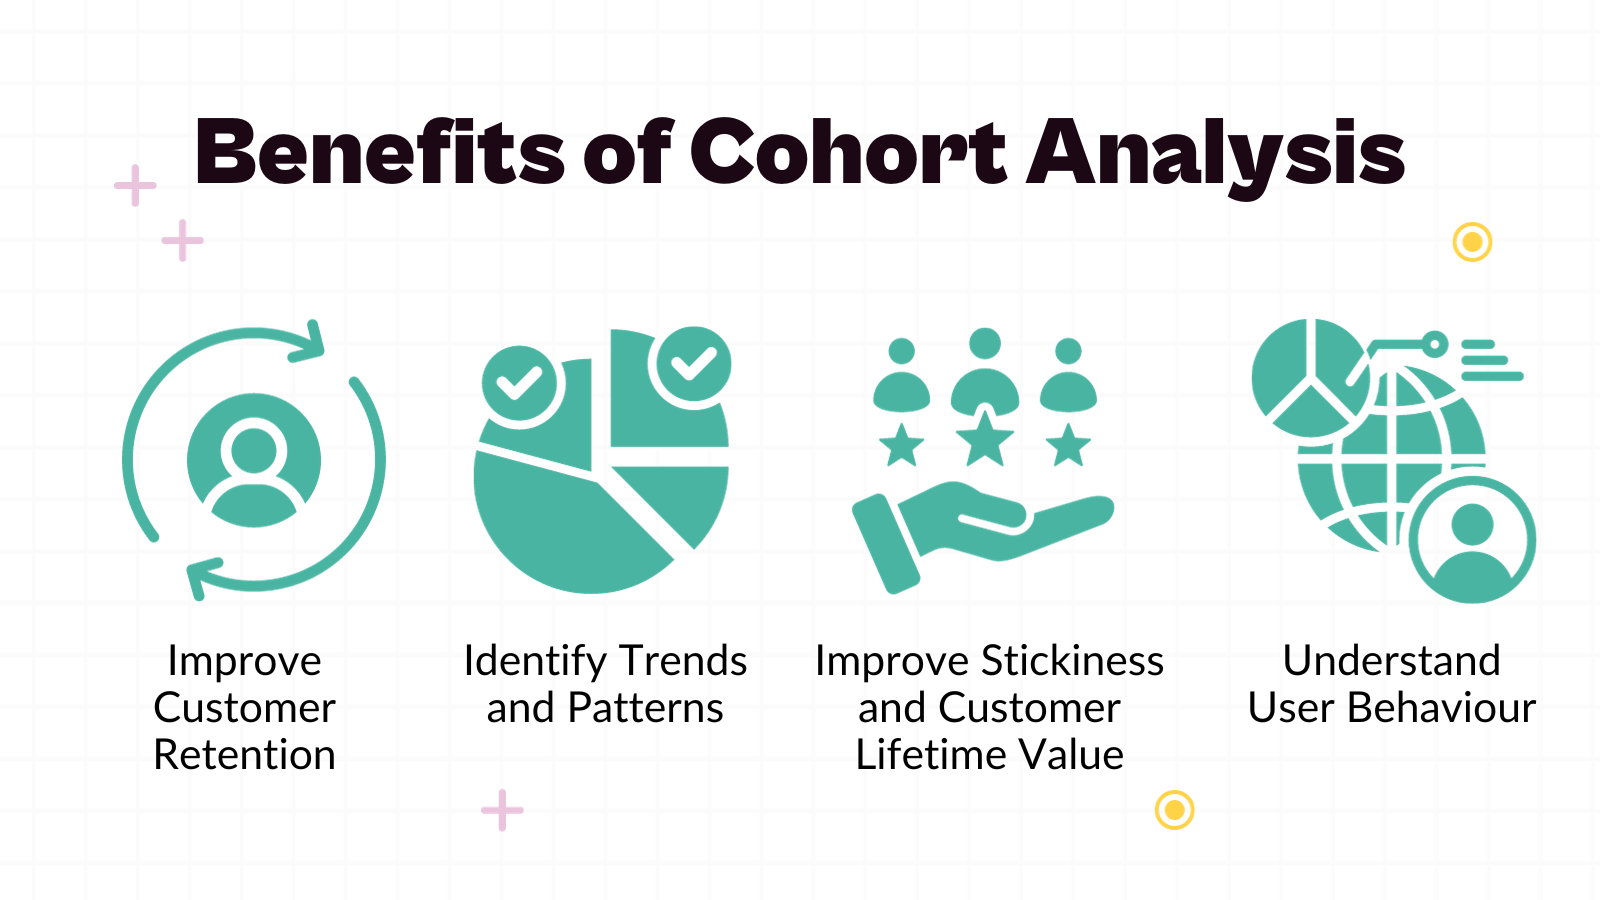
The cohort data analysis method involves classifying users by their common traits and following their engagement over time. Cohort analysis is particularly useful for tracking customer journeys and recognizing various action paths for subsets of customers in your product or service.

For example, if you run an online subscription service, you can develop cohort user groups based on the month of sign-up. As those cohorts engage with your product, you can monitor their actions as to whether they churn, upgrade, or refer. Looking at these cohorts can produce behavioral trends and patterns to build into your marketing plans.

Cohort analysis offers businesses insights into customer behavior and allows for a closer focus on actions across customer segments. For example, a cohort of users who signed up for your service during a promotional period may experience a higher churn. Retention strategies can also be adjusted for these types of campaigns in the future by digging deeper into cohort analysis. Cohort analysis allows organizations to focus more closely on differences across customers. This approach allows organizations to create better marketing and engagement strategies, ultimately becoming more impact-driven.

*houseware.io

Cluster Analysis

Cluster analysis is an exploratory data analysis method that groups similar data points into clusters. The goal is to identify structures within a dataset that can inform further analysis.

For example, in marketing, these types of analyses can segment customers based on purchasing behavior, allowing companies to tailor their marketing efforts. If an e-commerce platform identifies distinct clusters of customers—such as budget-conscious buyers and luxury shoppers—then it can create personalized marketing campaigns for each segment.

While cluster analysis reveals the existence of structures in your data, it doesn’t explain why they exist. Nonetheless, it serves as a valuable starting point for more profound analysis, helping businesses understand customer segments and target their marketing efforts more effectively.

*resonio.com

Time Series Analysis

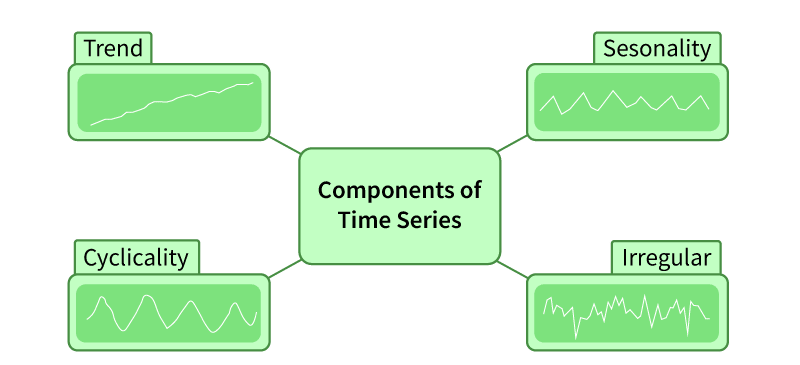
The study of the time series is looking at data collected (or recorded) at intervals of time. This technique is ideal for spotting trends, seasonality, and cycles in data over time. 

For example, a retail organization might analyze sales data on a monthly basis and look for seasonal trends. If sales consistently rise during the holidays, the organization can prepare for these events ahead of time by purchasing more inventory and increasing marketing efforts. 

In time series analysis, an analyst will seek data patterns in terms of trends (long-term movement in the data), seasonality (short-term variations), and cycles (influences of economic trends over time). After recognizing these patterns, a business can apply their forecasts and make better strategic decisions, resulting in greater operational efficiencies.

*geeksforgeeks.org

Sentiment Analysis

Sentiment analysis is a technique used to interpret and classify emotions conveyed in textual data. With the rise of social media and online reviews, understanding customer sentiment has become more crucial than ever.

This method involves using natural language processing (NLP) algorithms to analyze customer feedback, reviews, and social media posts. For example, a company might want to assess customer feelings about a new product launch. By employing sentiment analysis, they can categorize feedback as positive, negative, or neutral, providing valuable insights into customer perceptions.

There are various types of sentiment analysis, including fine-grained sentiment analysis (which focuses on opinion polarity), emotion detection (which identifies specific emotions), and aspect-based sentiment analysis (which targets specific product features). This depth of analysis allows businesses to understand not only how customers feel but also which aspects of their products or services are driving those feelings.

Sentiment Analysis

*exemplary.ai

Conclusion

An organization’s capacity to use robust analysis methodologies is important to keeping up with competitors in an ever-growing, data-dominated world. From regression to Monte Carlo simulations to cohort analysis to sentiment evaluation, these methods equip data scientists to translate complicated datasets into useful insights.  Once an organization understands these methods, it can rely on data to make decisions, develop its product or service with purpose, and increase customer satisfaction. 

As data continues to proliferate and becomes more complex, mastering these sophisticated consideration methods will be essential for anyone or any organization looking to succeed in the modern business world. Harnessing the possibility of data-based analyses will help enable innovation and build success in an increasingly competitive world. 

So, whether you’re a data analyst, a business leader, or simply someone interested in the domain of data analytics, becoming familiar with these powerful consideration methods will help you unleash the potential of data and make better-informed decisions.

Frequently Asked Questions

Why is Data Analysis Important Today?

Data analysis method plays a crucial role in the modern business landscape. It enables companies to assess their competitors’ performance, pricing strategies, marketing data analysis techniques, social media engagement, and more. With these insights, business leaders can make informed decisions, ensuring they take proactive measures to maintain their competitive edge.

What is the Most Popular Data Analysis Software?

Here are seven of the top data analytics tools:

    • Python
    • R Programming
    • SQL
    • Julia
    • Excel
    • Spark
    • Power BI

Is SQL a data analysis tool?

Yes, SQL (Structured Query Language) is a powerful data analysis method used for querying and manipulating data in relational databases. It allows data analysts to access and extract data from various tables within a database, making it readily available for analysis.

What is Tableau Used For?

Tableau is a data visualization and analysis tool that enables users to create charts, graphs, and dashboards. It helps in exploring and understanding large datasets, which facilitates informed business decisions.

Enquiry

Fill The Form To Get More Information


Trending Blogs

Leave a Comment