Descriptive vs. Inferential Statistics: Key Differences
Table Of Content
- Understanding Descriptive Statistics?
- Understanding Inferential Statistics
- Examples for Descriptive and Inferential Statistics
- Differences Between Descriptive and Inferential Statistics
Professionals across diverse fields such as science, mathematics, marketing, and technology rely on statistics to extract meaningful insights and draw conclusions from extensive datasets. The study of statistics is divided into two primary branches: descriptive and inferential statistics. These branches play distinct roles in uncovering various facets of data, enabling professionals to make informed decisions based on analytical findings.
Understanding different types of statistics, such as descriptive and inferential statistics, is crucial for developing a robust understanding of data management and choosing the most suitable analytical approaches. While certain measurement techniques may share similarities, the fundamental objectives of descriptive and inferential statistics diverge significantly. This blog explores the contrasting features of descriptive and inferential statistics, highlighting their unique roles and impacts in data analysis. By distinguishing between these statistical methods, professionals can effectively leverage them to extract valuable insights from complex datasets.
*geeksforgeeks.org
Understanding Descriptive Statistics?
Descriptive statistics is a field of statistics focused on summarizing and explaining the key aspects of a dataset. It involves techniques for organizing, visualizing, and presenting data in a meaningful and straightforward manner. Descriptive statistics characterize the properties of the dataset being analyzed without making broader assumptions beyond the data itself.
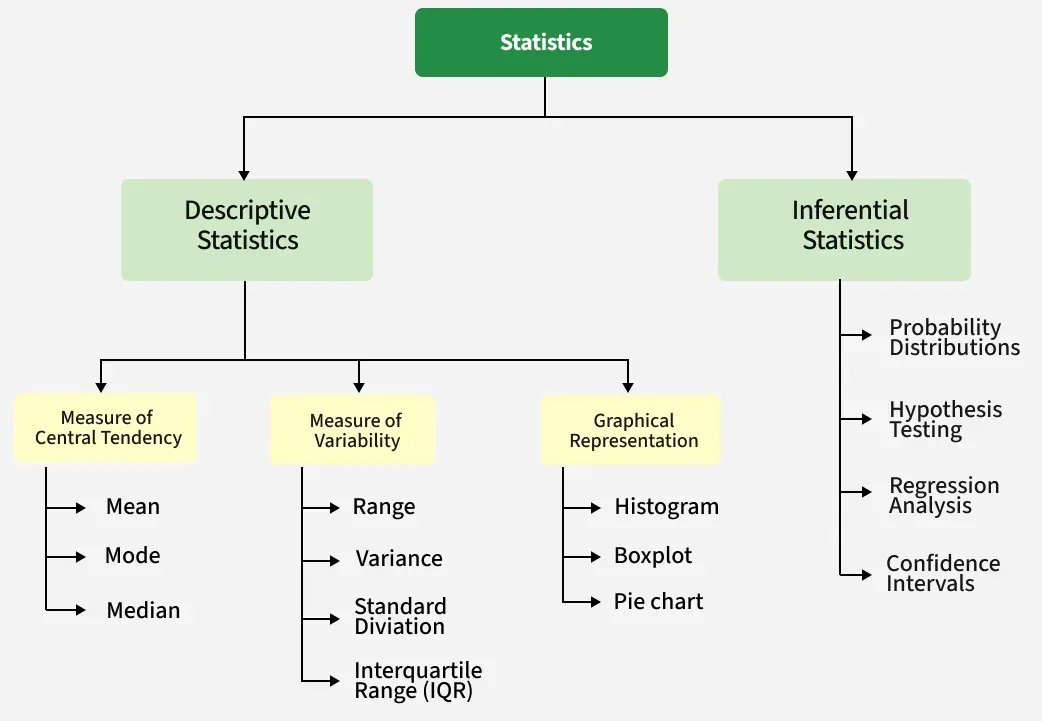
Types of Descriptive Statistics
Here are some different types of method for descriptive statistics:
1. Central Tendency: Central tendency is a method of summarizing data by identifying a central value to which all other data points are related. This central value can be represented by the median or the mean. In a normal distribution, these central measures often coincide.
2. Dispersion: Dispersion refers to how spread out the data points are within a dataset. Statisticians commonly use metrics such as variance and standard deviation to quantify the extent of spread among the dataset’s points.
3. Skewness: Skewness in statistics characterizes the distribution shape of a dataset when plotted. Normally distributed datasets exhibit little to no skew, with data points evenly distributed around the central point. In contrast, other datasets may show strong skewness either to the left or right of the center, depending on where the majority of data points are concentrated.
Understanding Inferential Statistics
In contrast, inferential statistics involves drawing conclusions, making predictions, or forming generalizations about a larger population based on data collected from a representative sample of that population. It extends the insights gained from a sample to the entire population from which the sample was taken. Inferential statistics enable researchers to reach conclusions, test hypotheses, and predict outcomes for populations, even when it is impractical or impossible to study the entire population directly.
Types of Inferential Statistics Method:
Below are important inferential methods commonly used in statistical analysis:
1. Hypothesis Testing: Hypothesis testing involves a statistician formulating a hypothesis about a population or sample and then collecting data from sample groups to test this hypothesis.
2. Regression Analysis: Regression analysis utilizes a dataset with confirmed data points to estimate the relationship between two variables, such as height and weight. This analysis enables statisticians and other professionals to make predictions for values beyond the measured data range.
3. Confidence Intervals: In research, statisticians often establish confidence intervals, which represent ranges of certain key values associated with specific probabilities. These intervals provide insights into the precision and reliability of statistical estimates.
Examples for Descriptive and Inferential Statistics
Descriptive Statistics Examples
For instance, Imagine a company wants to analyze the performance of its sales team over the past year. They gather data on monthly sales figures for each salesperson. To understand the distribution of sales and identify key insights, they use descriptive statistics. Here are the steps company need to follow for the analysis:
1. Measures of Central Tendency: The company calculates the mean (average) monthly sales for the entire team. They find that the mean sales per month is $50,000, indicating the typical performance level.
2. Measures of Dispersion: To understand how sales vary among team members, they calculate the standard deviation of monthly sales. They discover that the standard deviation is $15,000, suggesting a moderate level of variation in sales performance across the team.
3. Visualization: Using histograms or box plots, they visually represent the distribution of monthly sales. This visualization highlights whether sales data are symmetrically distributed or skewed towards certain values.
4. Percentiles: They calculate the 25th, 50th (median), and 75th percentiles of monthly sales. This helps identify sales levels at which specific percentages of salespeople perform, such as the median sales or the top quartile of performers.
5. Correlation Analysis: They explore correlations between sales performance and other factors like tenure, training hours, or geographic region. This analysis reveals if any factors are associated with higher or lower sales figures.
Inferential Statistics Example
Suppose a company is interested in understanding whether coffee consumption affects employee productivity. They decide to conduct a study where they gather data on coffee consumption and corresponding productivity levels among employees. Here is how step by step analysis process will look like:
- Hypothesis: The company hypothesizes that increased coffee consumption is associated with higher productivity levels among employees.
- Data Collection: They collect data on the number of cups of coffee consumed per day by each employee and their daily productivity scores (measured by completed tasks or output).
- Hypothesis Testing: Using inferential statistics, the company conducts a hypothesis test. They set up their null hypothesis (H0) that there is no relationship between coffee consumption and productivity (i.e., β = 0), versus the alternative hypothesis (H1) that there is a positive relationship (i.e., β > 0).
- Regression Analysis: The collected data is analyzed using regression analysis. They fit a regression model where productivity (dependent variable) is regressed against coffee consumption (independent variable). The regression model helps estimate the effect of coffee consumption on productivity while controlling for other factors.
- Interpretation: After running the regression, the company examines the coefficient of coffee consumption. If the coefficient is statistically significant and positive, it supports the alternative hypothesis that increased coffee consumption is associated with higher productivity.
- Conclusion: Based on the analysis and hypothesis testing results, the company concludes whether there is indeed a statistically significant relationship between coffee consumption and productivity among employees.


Differences Between Descriptive and Inferential Statistics
Purpose of Descriptive and Inferential Statistics
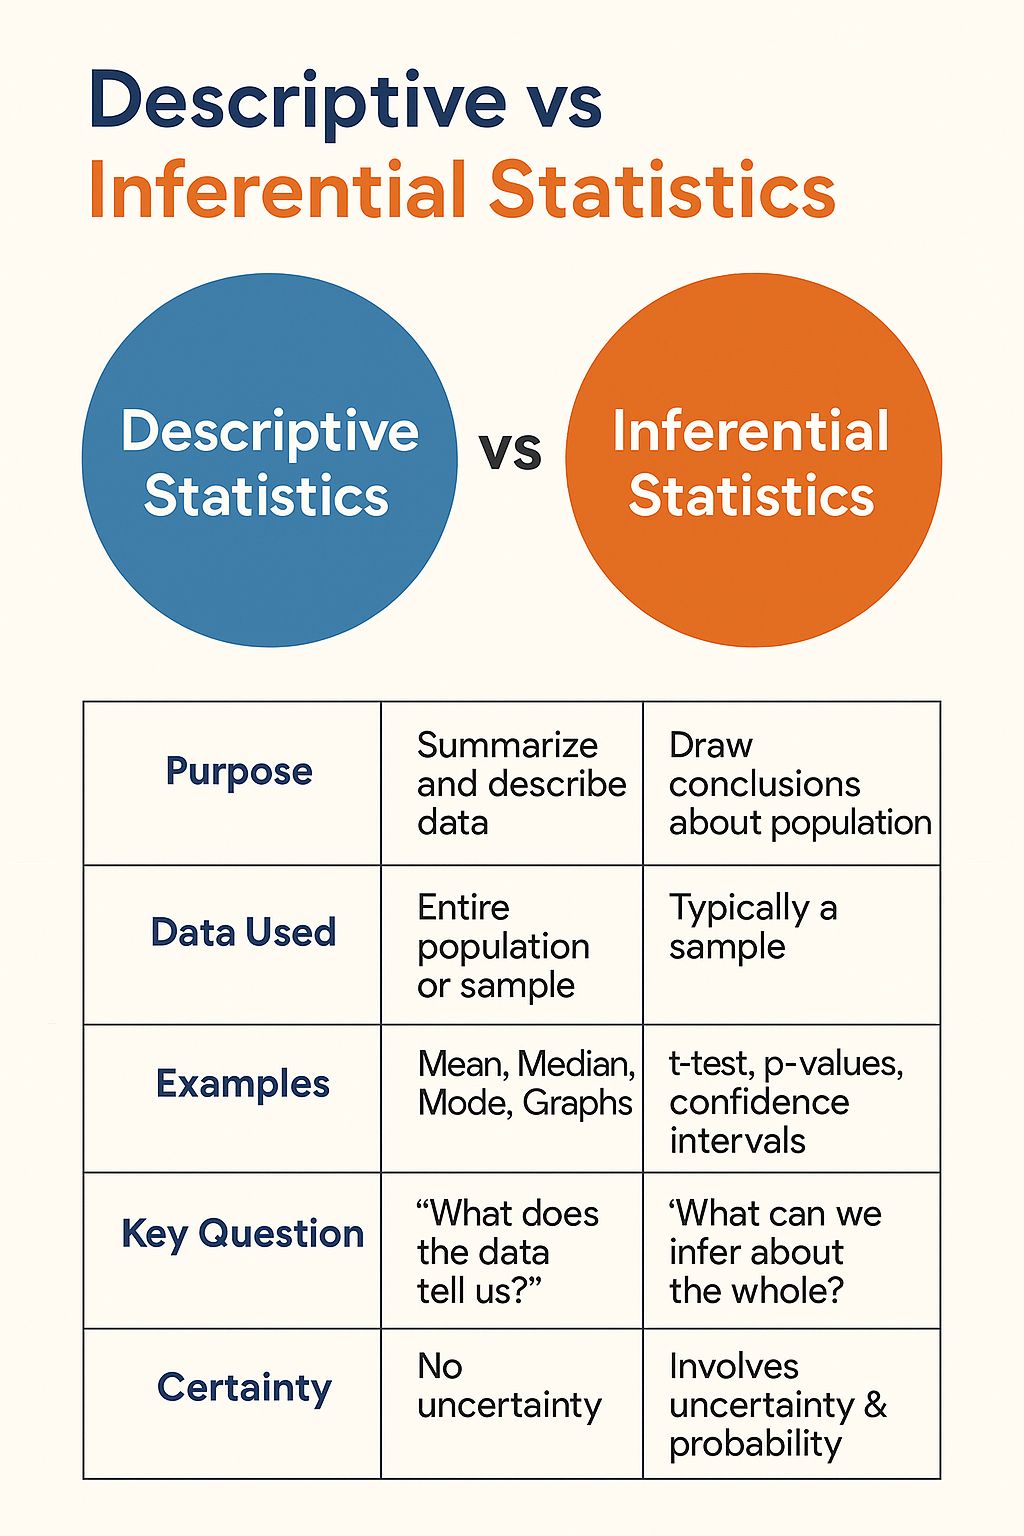
Descriptive statistics serve the purpose of summarizing and describing the characteristics of a dataset that is directly available to the statistician. This includes providing measures like central tendency (e.g., mean, median), dispersion (e.g., variance, standard deviation), and graphical representations (e.g., histograms, box plots) that depict the distribution of the data. For instance, in the scenario of collecting birth weight data from a hospital, descriptive statistics would be used to calculate the average birth weight of the children born within that specific hospital during a year.
On the other hand, inferential statistics are employed to make inferences or generalizations about a larger population based on a sample of data. The purpose of inferential statistics is to draw conclusions that extend beyond the specific dataset being analyzed. Using inferential methods, a statistician can estimate parameters, test hypotheses, and make predictions about the population from which the sample was drawn. In the given example, inferential statistics would be applied to estimate or predict the average birth weight of children nationwide, based on the sample data collected from the hospital. This allows for broader insights and conclusions to be drawn beyond the immediate dataset.
Approach of Descriptive and Inferential Statistics
Descriptive statistics involves analyzing data from a complete set, where every data point is collected and summarized. For instance, when determining the average height of students in a class, each student’s height is measured, providing a comprehensive view of that specific group.
The methodology of inferential statistics focuses on making broader conclusions or predictions about a larger population based on a representative sample. In this methodology, the statistician selects a sample that is representative of the entire population of interest. For example, if the teacher aims to infer the average height of all students in the school, the class data alone may not suffice as a representative sample. To utilize inferential statistics effectively, the teacher would need to construct a sample that includes students from different year levels across the school to ensure accurate representation of the overall student body.
Calculation Accuracy in Descriptive and Inferential Statistics
The precision of calculating descriptive statistics relies on the availability of complete data for the analysis. When using descriptive statistical methods, such as calculating the mean test score of a class, statisticians can achieve a better accuracy and precision because they have access to all necessary data points within the defined group or sample. For instance, a teacher calculating the exact average test score from a class of 20 students can achieve a precise measurement as they have all individual scores at their disposal. Descriptive statistics excel in precision when the entire dataset is known and can be directly analyzed, ensuring accurate measurements and insights into the specific group or sample.
The precision of inferential statistics is inherently influenced by the sampling process and the potential for variability and error when making predictions about a larger population based on a sample subset. Inferential statistics involve drawing conclusions or making estimations about a broader population from a representative sample. For example, using the average test score of a class to estimate the average test score of all classes taking the same test introduces uncertainty due to potential differences between the sample and the entire population. While inferential statistics provide valuable insights beyond the observed data, they carry the risk of error and require careful consideration of sampling methods and assumptions to ensure the reliability and accuracy of the inferences made.
Key Similarities Between Descriptive and Inferential Statistics
Descriptive and inferential statistics, although distinct in their purposes and approaches, exhibit some similarities:
1. Data Utilization: Both descriptive and inferential statistics utilize the same dataset. Descriptive statistics summarize this data, whereas inferential statistics use it to draw broader conclusions about a larger population.
2. Statistical Measures: They commonly utilize similar statistical measures like mean and standard deviation to describe datasets or infer information about populations based on samples.
3. Graphical Representations: Both types of statistics can employ graphical representations like histograms, box plots, and scatterplots to visually represent data trends and patterns.
4. Summary Statistics: Summary statistics are essential in both descriptive and inferential statistics to provide a concise overview of the data, including measures of central tendency and dispersion.
5. Analysis Foundation: Descriptive statistics form the basis for inferential statistics. Properly summarizing and understanding sample data is crucial before making accurate inferences about the broader population.
Conclusion
Descriptive and inferential statistics are important categories in statistics. Descriptive statistics focus on summarizing data to reveal its characteristics and patterns. Meanwhile, inferential statistics use sample data to make predictions and draw conclusions about a larger population.
Both types of statistics are essential for data analysis, complementing each other to provide a complete understanding of datasets. This blog has explained these concepts clearly, highlighting their differences with practical examples. Understanding descriptive and inferential statistics helps analysts and researchers make informed decisions in their work across different fields.


Find a Program made just for YOU
We'll help you find the right fit for your solution. Let's get you connected with the perfect solution.

Is Your Upskilling Effort worth it?

Are Your Skills Meeting Job Demands?

Experience Lifelong Learning and Connect with Like-minded Professionals

