Tableau Tools: The Future of Business Analytics
Table Of Content
- Understanding Tableau: A Brief Overview
- Key Features of Tableau
- Key Tableau Analytics and Data Visualization Tools
- Why Tableau Stands Out in 2025
What if we could transform data from being merely a collection of numbers in an Excel spreadsheet to an endless landscape of insights that propel your career forward? Data analytics tools are now skills that everyone who wants to stay competitive needs to have. Tableau is one of the most popular analytic tools available in the marketplace today, and it is easy to see why. Its clean design, the ability to visualize data, and integration capabilities support professionals during business transformations by driving actionable insights that unlock innovation and help make informed decisions.
This blog will explain why Tableau is the best business analytics tool to advance your data analytics career. Along with this, we will discover some of the best Tableau tools for organizations.
Understanding Tableau: A Brief Overview
Tableau was developed at Stanford in 2003 and quickly became a name associated with data visualization. Its distinguishing feature is transforming complex datasets into visually appealing interactive dashboards that anyone can engage with. Tableau allows users to combine and present data from any number of sources—databases, spreadsheets, cloud, etc. into a visual representation of data (or dashboards with charts, etc.) to assist in making decisions.
In other words, the Tableau tool offers some unique features that support both advanced users and those who do not have an acute analytic background. Tableau is also a presentation tool that visualizes and highlights data that will drive stories to support the analysis of key findings. These outstanding features alone make Tableau a must for business professionals to remain competitive over the coming years. So, if you are a business analyst or a corporate leader making key decisions based on data, understanding what Tableau can do to empower you will be incredibly important. We hope you enjoy this journey to support that the Tableau tool is the best analytic tool available for businesses.
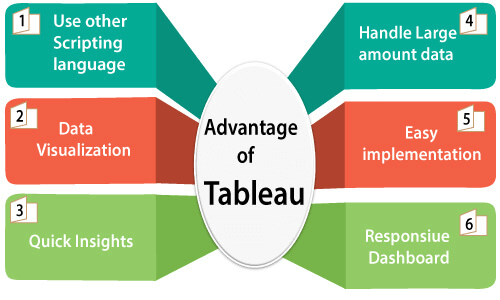
Key Features of Tableau
User-Friendly Interface: One of the excellent things about Tableau is its drag-and-drop functionality. Users can create visualizations without being technical experts. This means that professionals across all levels can create visualizations and learn from the data.
Powerful Visualizations: The Tableau tool offers a wonderful variety of visualizations — from basic charts to sophisticated graphs and interactive dashboards. Their scalability allows users to show data in the best way for that purpose.
Real-Time Data Analysis: Tableau allows users to connect to real-time data. This means an analyst can make up-to-the-minute decisions with the current data. This is a powerful feature for industry professionals who must react quickly, such as those in finance or healthcare.
Collaborative Features: The Tableau tool allows anyone to share dashboards/insights. This means that Tableau allows setting up collaborative teams to better meet their objectives and move to a data-driven culture.
Integration Capabilities: Tableau will connect seamlessly to a multitude of data sources, including SQL databases, clouds, and yes—even spreadsheets! So users can feel confident in working with the data source that they have identified.
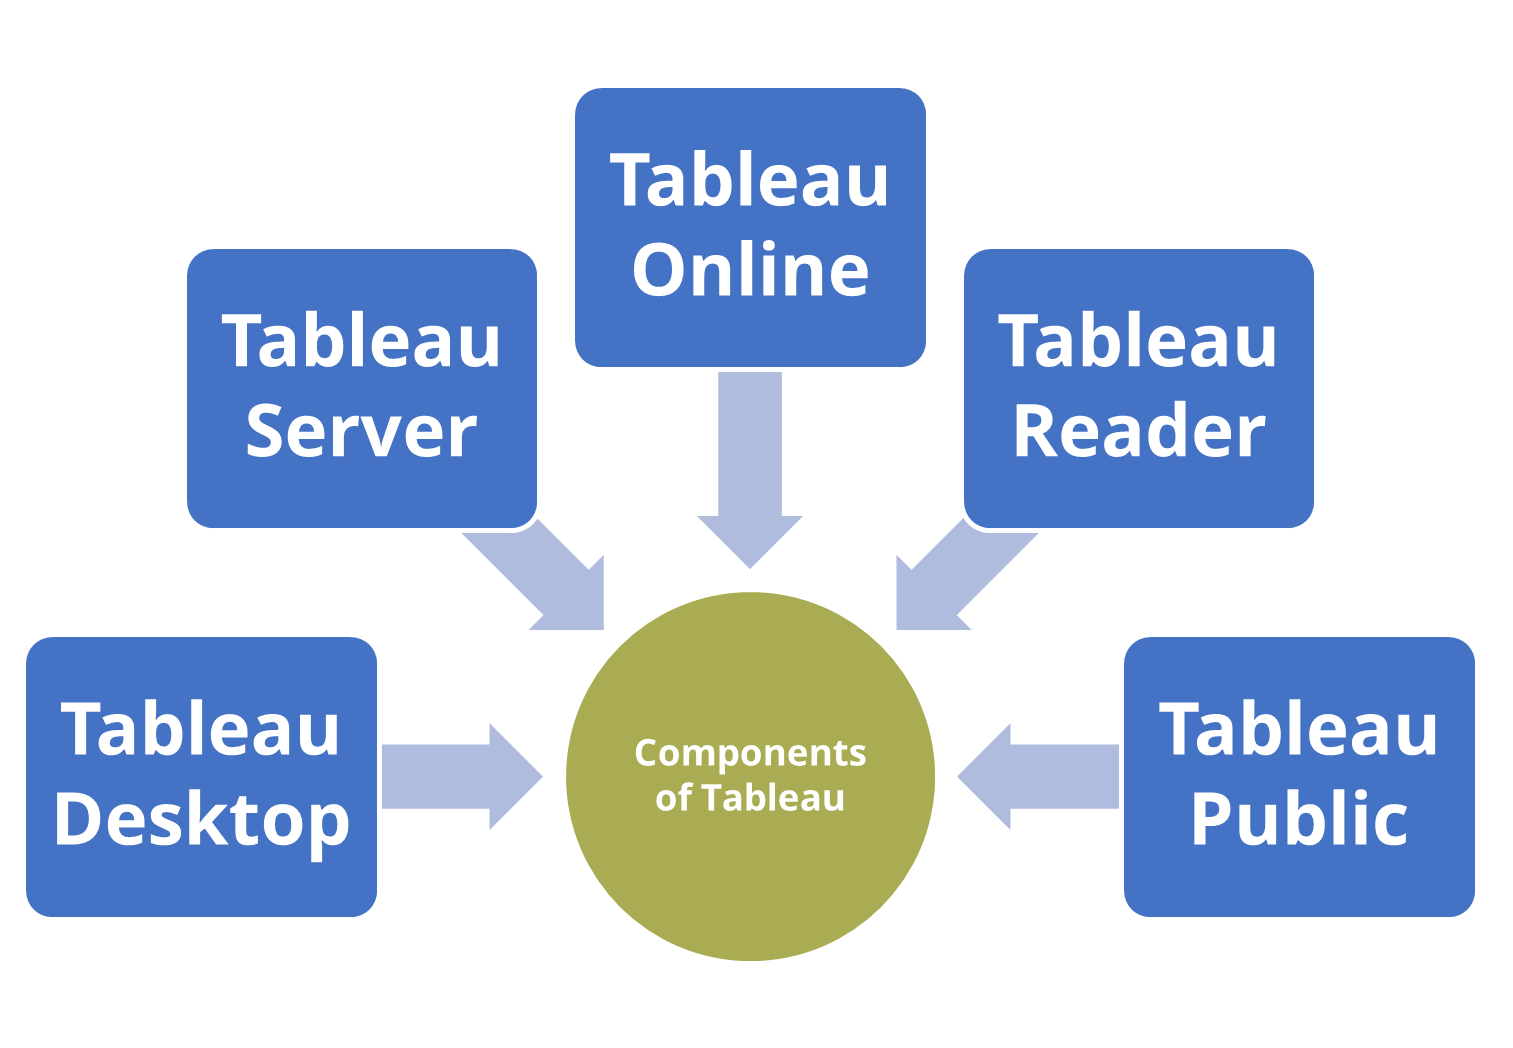
Key Tableau Analytics and Data Visualization Tools
Tableau provides a rich set of tools that improve Tableau analytics and Tableau data visualization to be more interactive and insightful. Each tool is fashioned to assist users in analyzing data effectively and displaying findings visually.
- Tableau Desktop: The primary tool for Tableau analytics, allowing users to build dashboards, charts, and reports with enhanced Tableau data visualization capabilities.
- Tableau Public: An open-source platform through which people can publish their Tableau analytics projects and display Tableau data visualizations for public consumption.
- Tableau Server: An application that enables organizations to securely share and manage Tableau analytics dashboards and provide controlled access to Tableau data visualization assets.
- Tableau Online: A cloud-based version of Tableau Server, providing remote access to Tableau analytics and live Tableau data visualization anywhere.
- Tableau Prep: Created to cleanse, blend, and organize raw data for Tableau analytics so one can easily prepare accurate and consistent Tableau data visualizations.
- Tableau Reader: Enables offline viewing and interaction with Tableau analytics workbooks, maintaining the interactivity of Tableau data visualization dashboards.
Together, these software tools make Tableau analytics an all-in-one solution for transforming complicated data into valuable Tableau data visualizations that inform smarter business decisions.
Why Tableau Stands Out in 2025
As we look ahead to 2025, the value of data-based decision-making is more important than ever. Below are several ways in which Tableau is the leading analytics tool for organizations and business professionals:
Versatility Across Industries: The Tableau tool is not limited to a single industry and can be used across multiple industries, like finance, healthcare, retail, and education. A retail company may analyze data regarding customers’ purchases, while a healthcare organization may visualize patient data for better treatment outcomes. This versatility ensures that Tableau is a useful tool for any business professional wanting to leverage data.
Data Storytelling: Data storytelling is important in today’s fast-paced business world. Tableau does an excellent job of this by visualizing data and letting the user create data stories. By using a mixture of graphs, charts, and contextual data, professionals can train themselves to report data effectively to key stakeholders so that everyone understands the meaning of the insights derived from the data.
Scalability Defined: As businesses grow, their data needs change. Tableau is easy to scale and will accommodate increasing data volumes and complexities. Whether for a startup or a large enterprise, Tableau provides solutions for your data analytics needs so you can focus on growing your career and not your data management.
Robust Community Support: The Tableau tool has an active community of users who share resources, tips, and best practices. This can be very valuable for professionals who are new to data analytics. Knowing there are accessible forums, user groups, and extensive online resources gives users comfort, as they can get help when needed.
Ongoing Innovation: Tableau commits to ongoing innovation, regularly rolling out updates to improve functionality. As technology changes, so does Tableau. Its tool continuously incorporates and integrates new features to maintain its leadership position. Continued focus on innovation ensures that users have the latest toolbox and methods.
User-Friendly Interface: Tableau’s intuitive and user-friendly interface allows business professionals of all skill levels to create complex visualizations without extensive training. This accessibility empowers more team members to engage with data, fostering a data-driven culture within organizations.
Real-World Applications of Tableau
To understand Tableau’s capabilities, we should review a few examples from real-world industries:
Health
Healthcare professionals can use Tableau to visualize patient outcomes, measure treatment effectiveness, and monitor operational efficiency. For instance, hospitals can look at completed patient readmission rates to see if there are emerging trends to inform patient care. By visualizing data, healthcare professionals can act faster and make more informed decisions that can improve patient outcomes.
Retail
Retailers use Tableau to analyze sales history, customer behavior, and their inventory. By visualizing sales trends and patterns, retailers can appropriately manage their inventory and adjust their marketing to increase customer engagement; i.e., a clothing company could determine which merchandise to put on sale by evaluating its popularity during various seasons.
Finance
The Tableau tool is utilized in finance for portfolio analysis, market trend visualization, and risk mitigation. Financial analysts could create dashboards to visualize real-time information about the market and adjust positions to shape performance. This method is especially useful during highly volatile periods, when it is important to respond to real-time events that impact profitability.
Education
Educational institutions leverage Tableau tools to track student performance, enrollment trends, and resource allocation. By visualizing this data, educators can identify areas for improvement and implement strategies to enhance student success. For example, a university might analyze dropout rates by program, helping them to pinpoint factors contributing to student attrition.
Tips for Success with Tableau
To get the best out of your experience with Tableau, follow these guidelines:
1. Train Yourself
Tableau provides several different resources to train and familiarize yourself with the tools. These include online courses, forums, and in-person training. Investing time in learning and understanding how to use the tools as best as possible will pay dividends down the road.
2. Start From Scratch
If a professional is an entirely new user of Tableau, try starting with simple visualizations and letting the confidence build over time. The more you use the tool, the more complex its features and functions will be.
3. Collaborate with Your Team
Value your team’s input by sharing dashboards and engaging with them. Such actions will allow you to create a data culture and allow everybody to work towards the same objective.
4. Keep Data Clean
Be mindful of cleaning your data and organizing it in a manageable manner before importing it into Tableau. Clean data makes visualization easier to achieve and provides better insight into your analytics as well.
5. Be Aware
Check for software updates and see what new features Tableau has in each release. Tableau is always innovating, and it is also very helpful to know about new items and tools in their new offerings.
Conclusion
In essence, Tableau stands out as the premier business analytics tool for businesses eager to harness the power of data. Its user-friendly interface, robust visualization capabilities, and adaptability across industries make it an invaluable asset for business professionals who want to drive data-informed decisions and propel their careers forward.
In a world increasingly driven by data, the ability to transform raw information into actionable insights is crucial. Tableau empowers users to create stunning visualizations and facilitates data-driven decision-making that can propel businesses toward success. Whether you’re in healthcare, finance, retail, or education, tools used in business analytics will undoubtedly enhance your analytical capabilities and position your organization for a successful future.
Are you prepared to dive into the world of Tableau? Then, look no further and gain real insights to unlock your business’s potential with Jaro Education. We are the leading online higher education and upskilling company in India, dedicated to bridging the gap between the online education system in India and learners. We have collaborated with renowned institutions to offer industry-standard programs and online degree courses that help business professionals and new learners excel in their fields.
Visit our website today to explore our programs related to management, technology, marketing, and more.
Frequently Asked Questions
The three most demanding soft skills required are:
- Critical thinking
- Communication
- Team building

Find a Program made just for YOU
We'll help you find the right fit for your solution. Let's get you connected with the perfect solution.

Is Your Upskilling Effort worth it?

Are Your Skills Meeting Job Demands?

Experience Lifelong Learning and Connect with Like-minded Professionals

