Top 10 Business Analytics Tools and Their Features
How Business Analytics Tools Improve Business Performance
Key Insights
Business analytics tools help organisations collect, process, and analyse data to identify trends, monitor performance, and make informed business decisions.
Popular tools include Microsoft Excel, Power BI, Tableau, SAS, Qlik Sense, Splunk, Sisense, Zoho Analytics, and Looker, each offering different analytical and reporting capabilities.
These tools support data visualization, KPI tracking, customer behaviour analysis, operational efficiency, and forecasting to help businesses identify opportunities for improvement.
Beginners can develop practical skills by learning Excel, creating dashboards with Power BI or Tableau, practising with real datasets, and building projects. Learning SQL, Python, and statistics can further strengthen their analytical abilities.
Every business generates data through sales, customer interactions, marketing campaigns, and daily operations. However, collecting information is only the first step. Businesses must analyse it to identify patterns, understand performance, and make informed decisions.
This is where business analytics tools become useful. They help organisations organise data, measure performance, identify trends, and present findings through reports and dashboards. Depending on their requirements, businesses can use these tools to understand customer preferences, monitor revenue, improve processes, and plan future activities.
Understanding the features and applications of the business analytics tools can help businesses choose a solution that fits their objectives, budget, and technical requirements.
Business analytics tools are software applications that help organisations collect, process, analyse, and interpret business data. They turn raw information into meaningful insights that support planning, performance measurement, and decision-making.
These tools can work with data from spreadsheets, databases, websites, customer relationship management systems, and other business applications.
For example, a retail company can examine sales figures to identify its best-performing products. A marketing team can compare advertising campaigns to understand which channels generate more conversions. A finance department can analyse revenue and expenses to assess profitability.
Depending on their capabilities, business analytics tools support four major types of analysis.
Descriptive analytics: Summarises historical data to explain what happened. For example, a report showing monthly revenue provides a descriptive view of business performance.
Diagnostic analytics: Examines data to understand why an outcome occurred. A business might investigate why sales declined in a particular region.
Predictive analytics: Uses historical data and statistical techniques to estimate possible future outcomes, such as customer demand or sales trends.
Prescriptive analytics: Evaluates potential actions to help organisations determine suitable responses to a business problem.
These approaches help businesses move from reviewing past results to investigating problems and planning future actions.
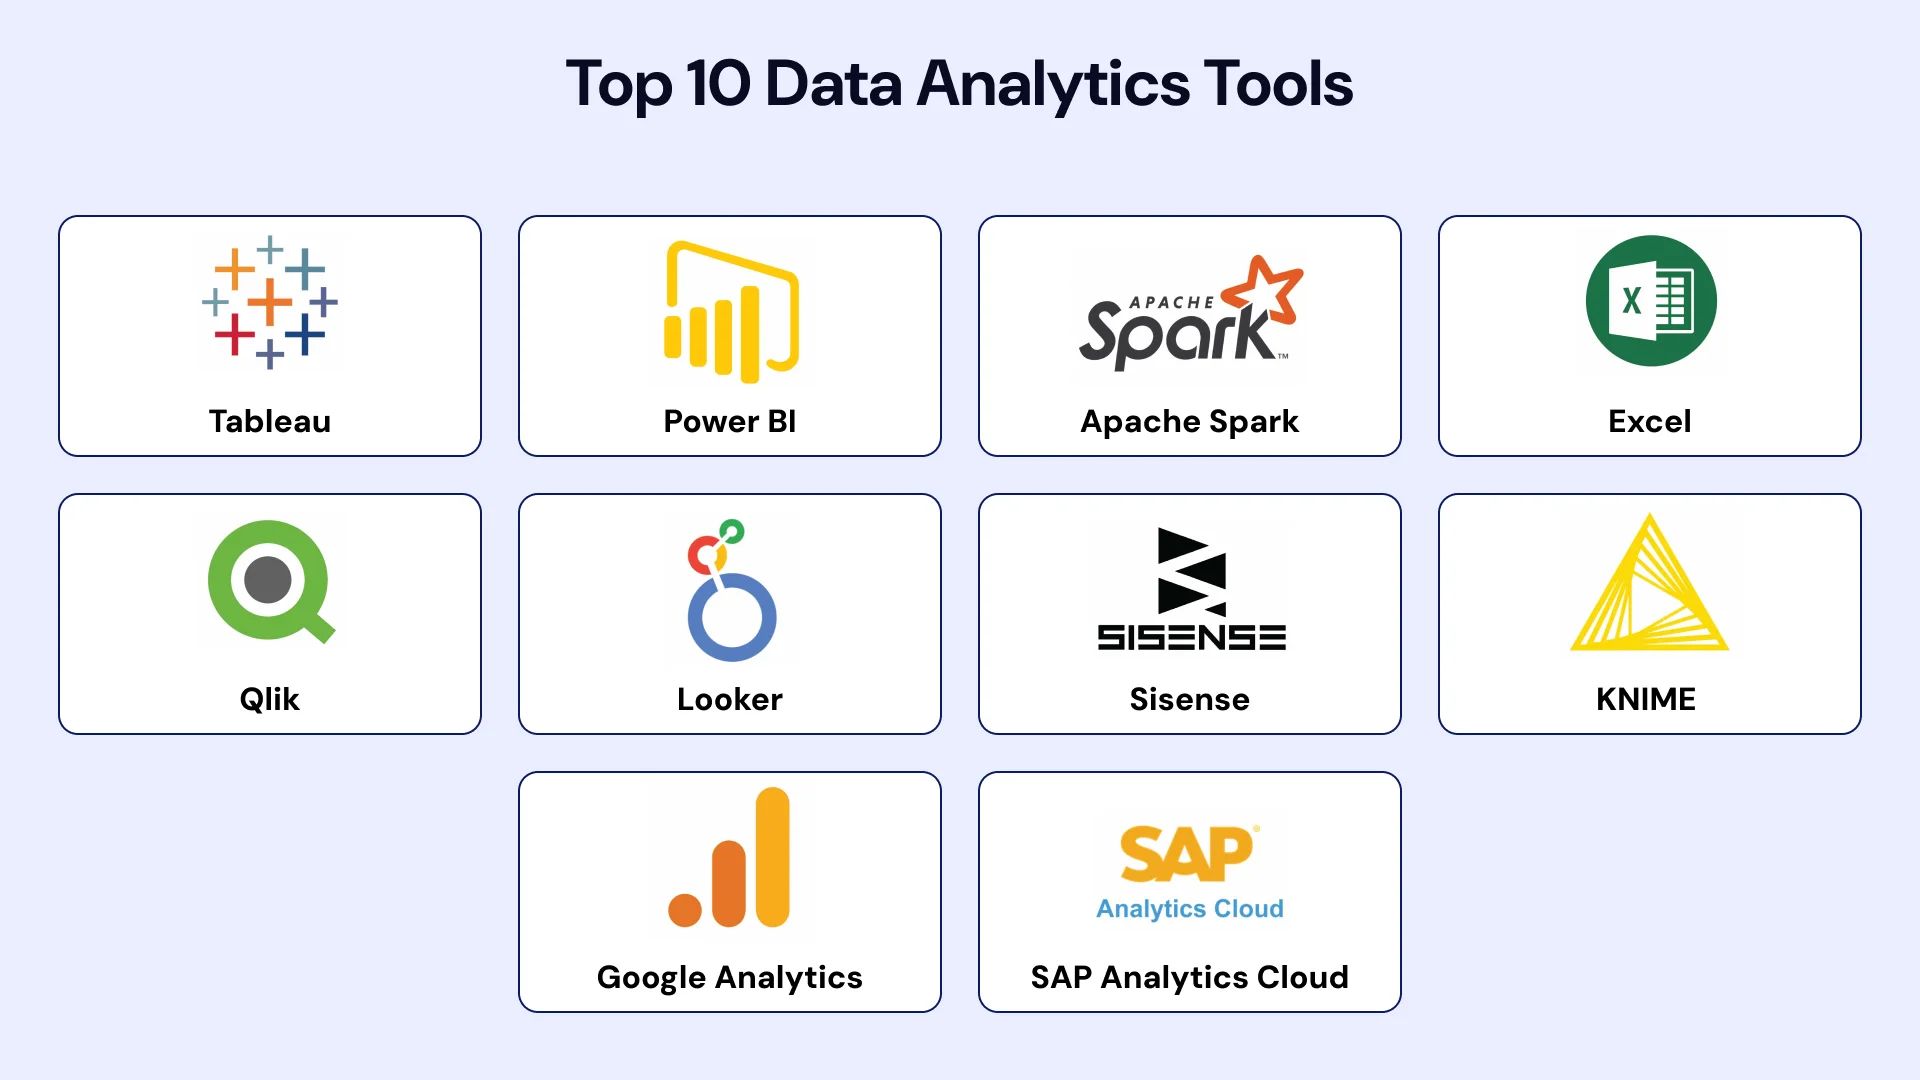
Top 10 Business Analytics Tools and Their Features
Credit:vlinkinfo.com
Different platforms address different analytical requirements. The following sections explain what each tool does, its important features, and how organisations use it.
1. Microsoft Excel
Microsoft Excel is a spreadsheet application widely used to organise, calculate, and analyse structured data. Its familiar interface makes it a practical starting point for students, business analysts, and professionals who are new to data analysis.
Excel supports basic calculations as well as more advanced workflows through formulas, PivotTables, charts, and data transformation features.
Key Features
Formulas and functions for calculations and data analysis.
PivotTables for summarising large datasets.
Charts for identifying patterns and comparing results.
Power Query for importing, cleaning, and transforming data.
Data validation and conditional formatting for improving data quality and readability.
Best For: Beginners, small businesses, and professionals who need flexible spreadsheet analysis.
2. Microsoft Power BI
Microsoft Power BI is a business intelligence platform that helps organisations connect data from different sources and turn it into interactive reports and dashboards.
The Power BI tool is particularly useful when teams need to monitor key performance indicators, compare results across departments, and communicate findings visually. It supports data transformation, modelling, and calculations, making it suitable for more complex reporting requirements.
Key Features
Interactive reports and dashboards.
Connections to multiple supported data sources.
Data preparation through Power Query.
Data modelling and calculations using DAX.
Filters and drill-down features for detailed analysis.
Report sharing and collaboration through the Power BI service, subject to licensing and access permissions.
Best For: Businesses that need interactive reporting, KPI monitoring, and integration with Microsoft products.
3. Tableau
Tableau is a visual analytics platform that helps users explore data and communicate findings through interactive visualisations. It is useful when business questions require comparisons across categories, locations, or time periods.
Instead of relying only on spreadsheets and static reports, users can create charts, maps, and dashboards that make relationships and trends easier to examine.
Key Features
Interactive charts, maps, and dashboards.
Connections to multiple data sources.
Visual filtering and data exploration.
Data preparation capabilities.
Options for publishing and sharing reports.
Best For: Analysts and organisations that prioritise visual exploration and interactive dashboard design.
4. SAS Business Analytics
SAS provides analytical software for statistical analysis, predictive modelling, forecasting, and other advanced analytical tasks. It is particularly relevant to organisations that need specialised methods beyond basic reporting.
Depending on the product, SAS can help professionals examine large datasets, build statistical models, and investigate relationships that may influence business outcomes.
Key Features
Statistical analysis and modelling.
Predictive analytics and forecasting.
Data preparation and management.
Support for advanced analytical workflows.
Reporting and visualisation capabilities in relevant products.
Best For: Enterprises and analytical teams that require advanced statistics, predictive modelling, or specialised analytical capabilities.
5. Qlik Sense
Qlik Sense is a business intelligence and analytics platform that helps users explore relationships between different datasets.
Its associative approach allows users to investigate connections across business information rather than relying exclusively on predefined reports. This can help analysts examine unexpected changes and identify relationships that require further investigation.
Key Features
Interactive dashboards and visualisations.
Data integration and preparation.
Associative data exploration.
Self-service analytics capabilities.
Collaboration and reporting features.
Best For: Organisations that work with connected datasets and need flexible data exploration.
6. Google Data Studio
Google Data Studio is a reporting and dashboarding tool that helps users turn connected information into shareable visual reports.
It is particularly useful for digital marketing and website performance reporting because it can connect with sources such as Google Analytics, Google Ads, Google Sheets, and Search Console.
Key Features
Customisable reports and dashboards.
Charts, tables, and visual elements.
Connections to supported data sources.
Filters and date-range controls.
Online sharing and collaboration.
Best For: Marketers, small businesses, and teams that need shareable reports, especially within the Google ecosystem.
7. Splunk
Splunk is a data platform commonly used to analyse machine-generated information, including system logs, application events, and operational data.
It helps technical teams understand system behaviour, investigate unusual activity, and monitor operational performance. Its primary focus differs from that of spreadsheet applications and traditional business reporting platforms.
Key Features
Collection and searching of machine-generated data.
Log analysis and event correlation.
Monitoring and alerting capabilities.
Operational dashboards and reporting.
Support for relevant IT operations and security use cases.
Best For: IT departments, security teams, and organisations that need to analyse logs and monitor technical environments.
8. Sisense
Sisense is an analytics platform that helps businesses analyse data and integrate insights into applications, products, and workflows.
Its embedded analytics capabilities allow organisations to make reports and visualisations available within the environments their users already work in. This can be particularly valuable for software companies that want to provide analytical features as part of their products.
Key Features
Interactive dashboards and visualisations.
Data integration and modelling capabilities.
Embedded analytics for applications.
Reporting and data exploration.
Options for delivering insights to different user groups.
Best For: Businesses that want to integrate analytics into their own products or existing applications.
9. Zoho Analytics
Zoho Analytics is a business intelligence and reporting platform that helps organisations combine information from different sources, examine performance, and create visual reports.
It offers features for data preparation, reporting, and dashboard creation. Its suitability depends on the organisation’s data sources, analytical requirements, and selected subscription plan.
Key Features
Integration with supported data sources.
Interactive reports and dashboards.
Data preparation and visualisation.
Scheduled reporting and collaboration.
Analytical capabilities for identifying patterns and trends.
Best For: Small and medium-sized businesses looking for accessible reporting and business intelligence capabilities.
10. Looker
Looker is a business intelligence platform that helps organisations explore data, create reports, and work with consistently defined business metrics.
It supports structured analytics by allowing organisations to define metrics centrally. This helps different teams work with consistent business definitions rather than calculating the same metric differently across separate reports.
Key Features
Data exploration and reporting.
Centralised modelling of business metrics.
Customisable dashboards.
Integration with supported data sources.
Collaboration and governed access to information.
Best For: Data-driven organisations that need governed analytics and consistent reporting across teams.
Free Courses
Free Microsoft Excel course: : Beginner to Advanced
How Business Analytics Tools Improve Business Performance
The value of analytics comes from how organisations use information to improve decisions and evaluate outcomes. These business analytics tools support several important business activities.
1. Informed Decision-Making
Analysing historical performance and current results gives managers evidence to consider when making decisions. For example, sales trends can help a company evaluate whether a product category needs additional attention.
2. Operational Efficiency
Businesses can examine workflows to identify delays, repeated tasks, resource gaps, and process bottlenecks. Teams can then investigate potential improvements and measure their effects.
3. Performance Monitoring
Dashboards help teams track sales, expenses, customer acquisition, productivity, and other KPIs. Comparing actual results with targets makes it easier to identify differences that require investigation.
4. Customer Understanding
Analysing transactions, feedback, and engagement patterns can help organisations understand customer preferences. These findings may inform product development, service improvements, and marketing decisions.
5. Planning and Forecasting
Historical data and predictive models can support demand forecasting, budgeting, inventory planning, and risk assessment. Forecasts should still be evaluated alongside current market conditions and professional judgement.
How to Develop Practical Skills using Business Analytics Tools
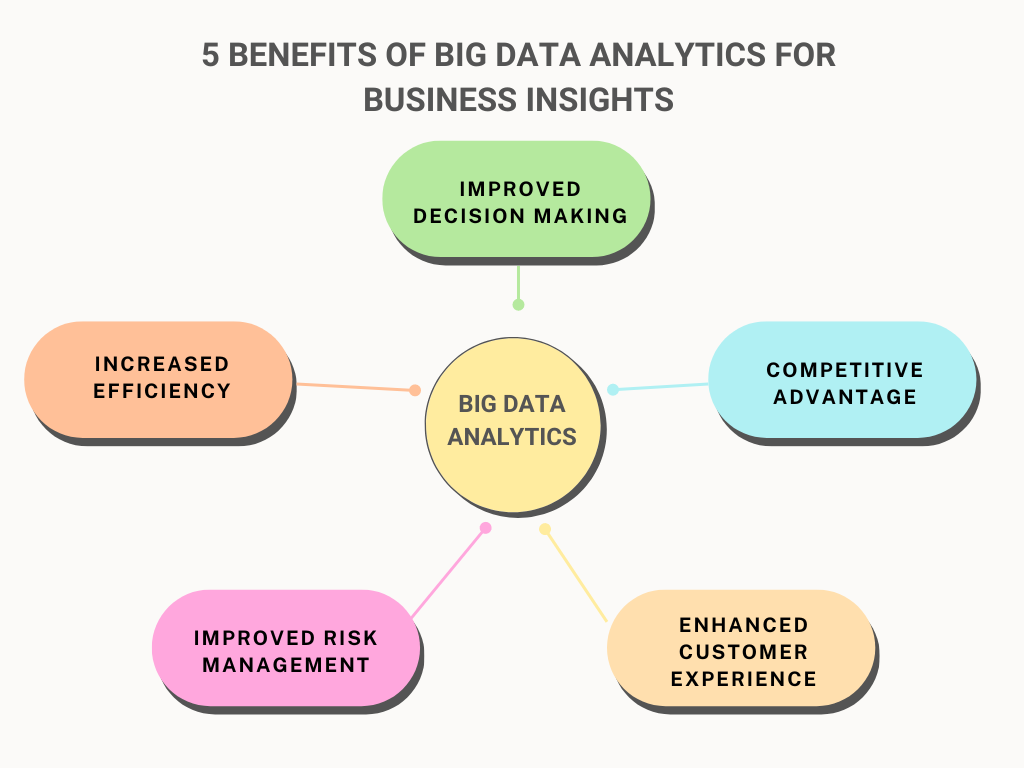
Credit:alibabacloud.com
Learning about Business analytical platform is a useful first step, but practical experience helps you understand how data supports real business decisions.
The following steps can help beginners build a foundation.
1. Learn Spreadsheet Fundamentals
Start with Excel or a similar spreadsheet application. Practise organising datasets, cleaning inconsistent entries, using formulas, and creating PivotTables.
2. Develop Data Visualisation Skills
Create simple charts and dashboards using Power BI or Tableau. Focus on presenting information clearly and choosing visualisations that answer specific business questions.
3. Work on Practical Projects
Use sample datasets to investigate monthly sales, customer retention, marketing performance, or operational expenses. Identify patterns and explain what the findings could mean for a business.
4. Learn Relevant Technical Skills
Depending on your career goals, develop skills in SQL, statistics, data modelling, or Python. These can help you work with larger datasets and perform more advanced analysis.
5. Build a Project Portfolio
Prepare two or three projects that demonstrate your ability to organise data, analyse results, and communicate insights. For each project, describe the business question, your approach, key findings, and limitations.
Business Analytics Programmes to Build Practical Skills
Learners looking to develop practical skills can explore programmes in business analytics offered through Jaro Education, along with free courses to build their analytical knowledge.
The right business analytics tools can help businesses understand performance, identify trends, and make data-driven decisions. From Excel for spreadsheet analysis to Power BI and Tableau for interactive dashboards, data visualization, each tool serves different needs. Comparing their features, ease of use, and analytical capabilities helps businesses choose suitable solutions. For beginners, practising with real datasets and building projects is a practical way to develop analytical skills.
Frequently Asked Questions
Microsoft Excel, Power BI, Tableau, SAS Business Analytics, Qlik Sense, Google Data Studio, Splunk, Sisense, Zoho Analytics, and Looker are ten tools used for different business analysis and reporting needs.
Analytics tools for business help organisations analyse sales, track performance, understand customer behaviour, monitor operations, and identify opportunities for improvement.
Consider your business objectives, budget, data sources, ease of use, integration requirements, reporting features, and the technical skills of your team.
The Power BI tool connects data from different sources and helps users create interactive dashboards, track key performance indicators, and share reports to support business decisions.
Microsoft Power BI and Tableau are widely used BI tools for data visualization. They help users present complex datasets through charts, graphs, and interactive dashboards.
Yes. Beginners can start with Excel to learn data organisation, formulas, and PivotTables before progressing to Power BI or Tableau for dashboard creation and visual analysis.
Useful skills include Excel, data visualisation, statistics, critical thinking, and data interpretation. Knowledge of SQL, Python, or data modelling can also help with more advanced analytical tasks.
Shubham Lal
Lead Software Developer
Shubham Lal joined Microsoft in 2017 and brings 8 years of experience across Windows, Office 365, and Teams. He has mentored 5,000+ students, supported 15+ ed-techs, delivered 60+ keynotes including TEDx, and founded AI Linc, transforming learning in colleges and companies.
Get Free Upskilling Guidance
Fill in the details for a free consultation
Related Courses
Explore our programs
Executive Certification in Advanced Data Science & Gen AI for Managers

 April 25, 2025
 9 min read





 Key Insights
 ChatGPT
 Perplexity
 Claude
 Grok








 ROI Calculator