

Reporting in BI: Step by Step Guide
Table of Contents

- jaro education
- 28, August 2023
- 5:00 pm
Reporting in BI is a function gaining significance with every passing year. BI reporting, broadly described as gathering and analysing business data, can offer insightful information to anyone including towards making informed decisions. The rise in demand for BI reports in almost all industries is fueled by the constant technological advancements that enable working with enormous amounts of information accessible to more professionals.
Understanding reporting in BI requires guidance from experts. IIM Kozhikode’s Professional Certificate Programme in Advanced Analytics & Business Intelligence is intended to guide individuals working in business management to get a grip on various business intelligence topics like reporting BI. It offers crucial ideas about unstructured data analysis and business analytics. This course can improve analytical and business intelligence skills. With a focus on avoiding interference with job duties, the program’s material is intended to enhance data-driven decision-making skills.
Understanding the Basics of Business Intelligence Reporting
Although the fundamentals of BI reporting may be summed up as gathering and analysing big data sets to offer real-time insights into business operations, a business intelligence report involves much more than this. Data visualisation is one of the main ways that business intelligence reporting makes these insights possible. When one is looking at continuous streams of numbers, it might be challenging to make judgements. But it’s a lot simpler when the data is provided in a transparent manner.
Various Types of BI Reporting
Different types of BI reporting serve specific purposes and require particular data. Here are three main types used in the firms:
Performance Management BI Reporting
These reports provide insights into the performance of an organisation’s individuals, teams, or departments. They go beyond financial numbers and consider various key performance indicators. These reports help senior management make strategic decisions and identify areas of success or improvement.
Predictive Analytics BI Reporting
This type of reporting uses current and historical data to make reliable predictions. It helps businesses anticipate future outcomes or understand the causes behind past events. Predictive analytics tools remove uncertainty from decision-making and find patterns and relationships in data to identify threats and opportunities.
Augmented Analytics BI Reporting
Augmented analytics uses AI and ML to automate data discovery and preparation. It reduces human error and biases in data analysis and provides more accurate insights. While still in the early stages, augmented analytics has broad applications across industries.
Business organisations can improve their overall performance and receive useful information from these sorts of reporting.
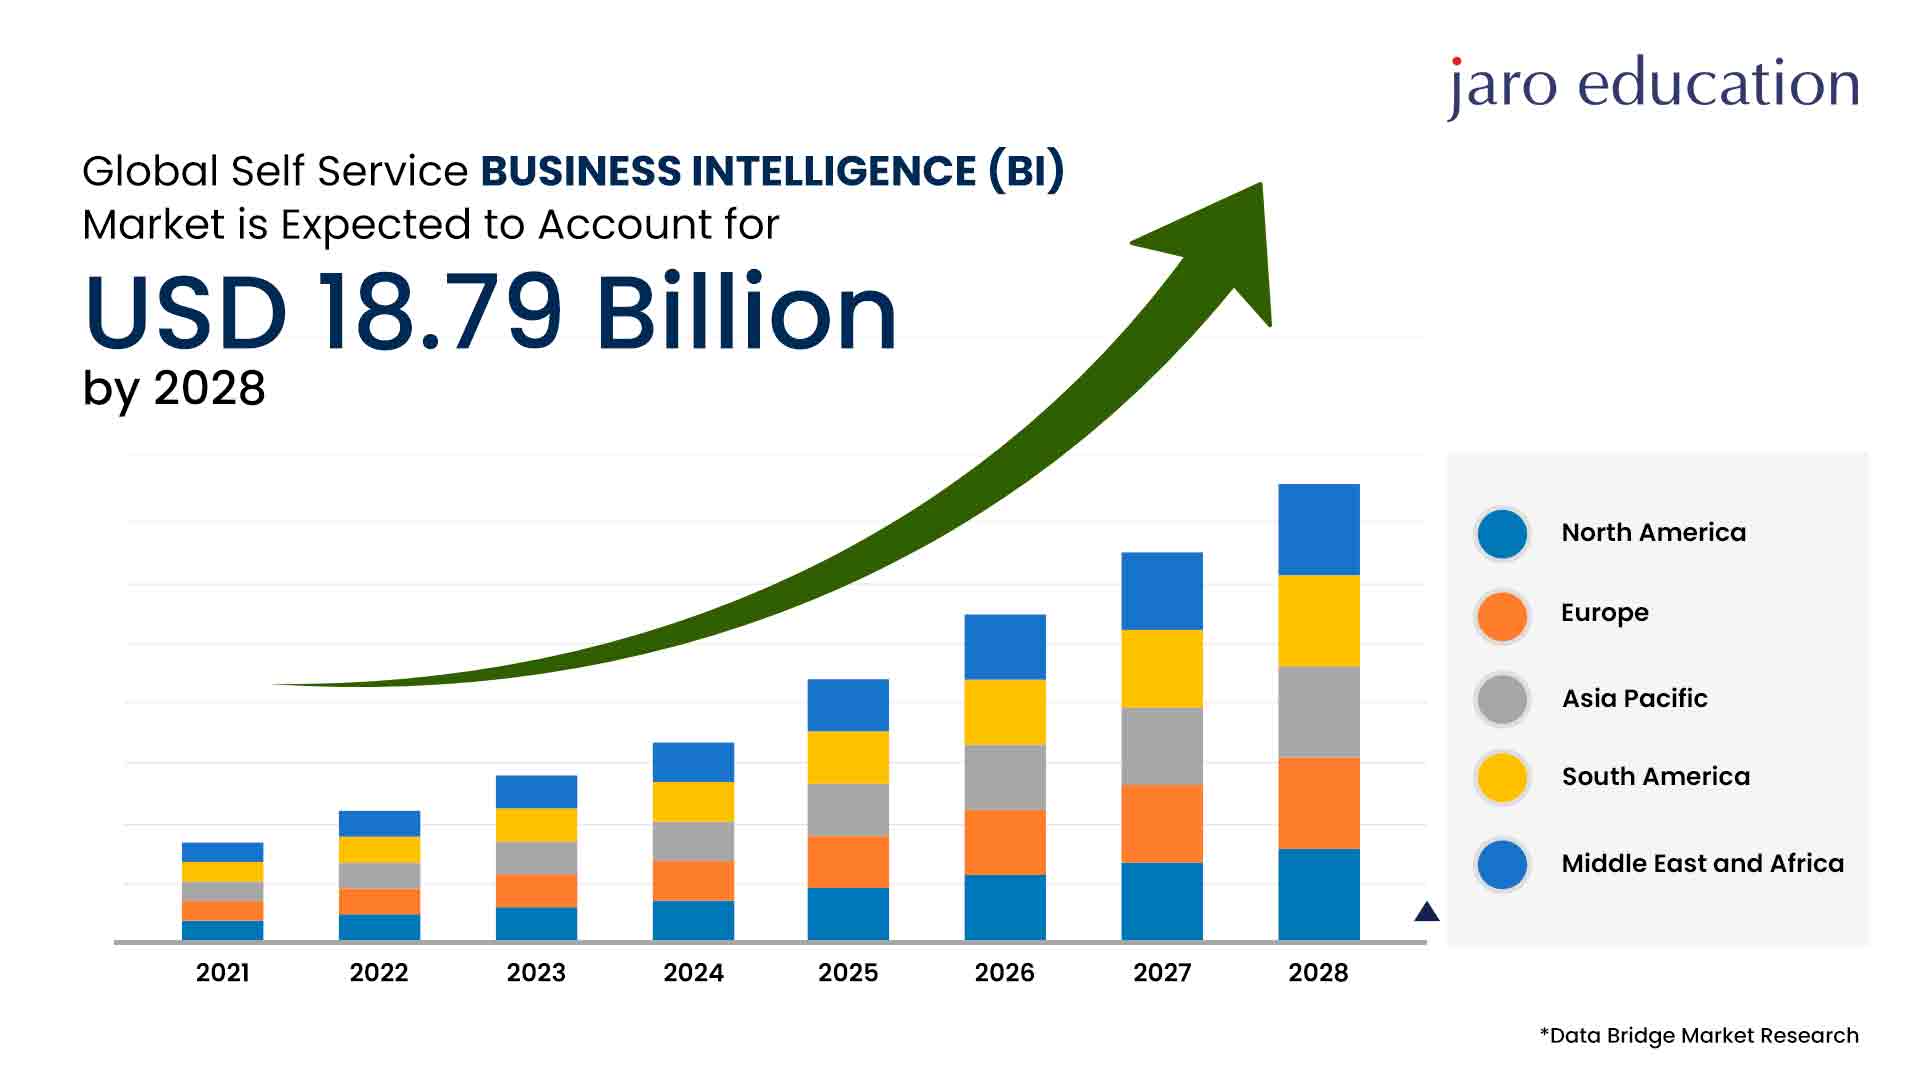
*Data Bridge Market Research
An Instructional Guide for BI Reporting
In the past, sophisticated data modelling and a solid understanding of SQL were necessary for reporting with business intelligence (BI). Fortunately, BI reporting today is significantly less complicated. Reporting on business intelligence is the process of visualising data in reports and dashboards to aid in decision-making. Modern BI reporting requires one to go through eight steps if someone is starting things from scratch.
1. Evaluate Data Maturity
As the business expands, it goes through four stages of data maturity. Identifying the current stage will help determine the appropriate approach for addressing the specific requirements in BI reporting. The stages are as follows:
Stage 1
In this stage, the data is scattered across different sources such as Google Analytics, Salesforce, and individual databases. BI reporting requires consolidating and managing these disparate data sources. The analysis is often conducted within separate systems, making it challenging to combine data effectively, except by exporting it to tools like Google Sheets.
Stage 2
At this stage, one can start combining data from various sources into a centralised location, a data lake. However, the data could be more structured. To perform BI reporting, preliminary transformations, like selecting relevant columns and anonymising personally identifiable information, must be performed to ensure data compatibility.
Stage 3
In the data warehouse stage, the centralised data is structured to facilitate easy usage across the organisation. BI reporting becomes more seamless, with a suitable BI platform allowing efficient querying and data visualisation.
Stage 4
The data mart stage involves granting specialised access to specific sections of the structured data for different teams in the organisation. BI reporting becomes simpler, focusing on empowering non-technical users to create their reports or dashboards.
Understanding the stage of a business data maturity helps select the appropriate BI reporting platform. It’s important to note that each stage has its own intricacies, but recognising one’s stage will guide them in making informed choices for their BI reporting needs.
2. Decide on a BI platform.
A BI platform is required to perform BI reporting. A competent BI platform should perform three functions necessary for the progress through the four phases of cloud-based data maturity. While choosing a BI platform, one should consider the following aspects.
Compiles data
The BI platform should be able to consume all the required data, whether from a collection of sources, a lake, or a warehouse. Businesses in stage 1, where data is dispersed among a few different technologies, will find it helpful to gather all their data. A more cohesive dataset can be created by blending the data on the BI platform.
Assistance in Understanding Data
SQL should be supported for data queries on the BI platform. The more convenient the BI platform makes it to use SQL, the better. Businesses in phases 2-4 can benefit significantly from simple-to-use query builders like visual query builders. Companies at this level want more staff to use their advanced data infrastructure. Despite the bias, Visual SQL is a fantastic example of a BI platform that makes it simple to analyse the data.
Data visualisation
Every BI platform’s primary functionality, which benefits businesses at every stage of cloud data maturity, is visualising data to help decision-making.
3. Distinction between: Reports and Dashboards
BI reporting has two distinct types of visualisations: reports and dashboards. Understanding the differences between these visualisations is crucial to report activities effectively.
Reports
Reports are static and utilise historical data to make future predictions. Their primary objective is to comprehensively analyse past events, enabling decision-makers to gain insights and identify trends. Due to their detailed nature, reports require significant effort and are typically generated at regular intervals such as weekly, monthly, or quarterly.
Dashboards
On the other hand, dashboards are real-time and often interactive, focusing on facilitating on-the-spot decision-making. The primary purpose of a dashboard is to provide a real-time snapshot of key metrics and performance indicators. While dashboards require some initial setup time, they primarily operate autonomously, requiring only occasional adjustments.
4. Connection of the sources
After selecting and configuring the BI platform, it is time to connect the data. There are primarily two methods for integrating the data with the BI platform, which are discussed in this segment.
Connecting Directly
BI platforms’ proprietary connections do most of the work. Submit the login information and if applicable, a unique key for each data source. The number of references in a platform’s library is the first indicator of its quality; the higher the number, the better the quality.
SSH Tunnel
To address specific requirements, businesses may opt for a more technical solution by having their developers establish an SSH tunnel. This secure method enables the connection between their data source, data lake, data warehouse, and the BI platform. This approach is particularly suitable for businesses that store their databases on private connections or need to consider firewall restrictions.
5. Determine the target audience and goal
To accomplish the visualisation goals effectively, it is crucial to have a clear objective in mind. Determine whether one needs a quick ad hoc visualisation or a comprehensive report, and design the work accordingly. Understand the audience, whether they are busy executives needing executive summaries or individual contributors desiring detailed insights. Identify the decision they need to make and the supporting data required, whether it’s a static report or a real-time dashboard, keeping this purpose at the forefront while creating the visualisations.
6. Analyse the data
The next step is to use queries to retrieve the data one requires. The purpose and audience should guide the facts that one should employ. To communicate with databases and data warehouses, construct queries in the coding language SQL. We can choose the data ranges we want to compare and link them using questions to simplify comparisons. SQL is the only way to query data; thus, becoming proficient with it is beneficial. However, to make them easier for non-technical users, many BI platforms have their proprietary ways of interacting with SQL.
7. Visualising the data
After querying the data in the chosen BI platform, the results will be displayed in a table called the “Result Table.” On the top right is a “Chart Preview” where one can select the desired visualisation. People can easily customise their visualisations by manipulating the Result Table like a spreadsheet and adjusting the automatically generated charts in the Chart Preview. Once the desired charts are created, click the designated button to save them to the dashboard. Remember that this process may vary across different BI platforms, so it’s essential to compare and choose the one that suits one’s needs.
8. Share the Report or Dashboard
Sharing the BI reporting requires careful consideration of the context to ensure it can be effectively acted upon. Options for sharing include:
- Keeping the report or dashboard within the BI platform and granting access or providing links to authorised users.
- Displaying the report/dashboard on a TV or monitor.
- Setting up automated email reports and Slack alerts based on specific dashboard conditions.
- Embedding the dashboard online, within one’s product, or in other tools for accessibility.
Advantages of Business Intelligence Reporting
As BI reporting is fully incorporated into an organisation’s information architecture, it adds programmable knowledge and utility. In business intelligence, many sorts of reports lessen the likelihood of biases that develop when senior executives become involved and absorbed in their data. Users of business intelligence reports can see the broader picture and make decisions that are better for the business overall rather than just a quick fix. Because of its impartiality and organisational security, BI reporting offers several benefits to businesses of all sizes.
Conclusion
Many organisations need clarification of BI reporting and how it may help them grow their business significantly. In today’s business environment, having a grasp of Power BI report best practices and how they benefit an organisation is essential. Therefore, you can learn about BI reporting in BI courses if you’re interested in business intelligence reporting employment with a curiosity to understand the process of producing and delivering reports from data.
The IIM Kozhikode course on unstructured data analysis makes it possible to learn about BI reporting while engaging in actual, practical participation. Enroll in this programme through Jaro Education to gain an unparalleled learning opportunity that will help you to overcome the challenges caused by advanced analytics. You will acquire a unique mix of academic understanding and practical training in different data processing techniques across the programme, preparing you for the future.
Recent Blogs


Trending Blogs